

The Crosstown Crime Book: July


The Los Angeles Police Department makes its data publicly accessible, and regularly updates crime statistics, but it can be difficult to uncover the information. With the Crime Book, Crosstown is launching a monthly dive into the state of public safety, examining how a set period compares both to the recent past, and to previous years, in the effort to provide context to the numbers. Here is how things looked in the city of Los Angeles in July.
Murder city
Los Angeles reached a grim milestone last month, with 48 murders recorded by the LAPD. Not only was it the highest monthly tally in at least a decade, but it was nine more people killed than the previous month, and represented a 135% increase over the 20 homicides in April.
Summer typically brings an uptick in crime in Los Angeles, but the tally last month soared well beyond the four previous Julys.
Homicides in Los Angeles in the month of July, 2017-2021

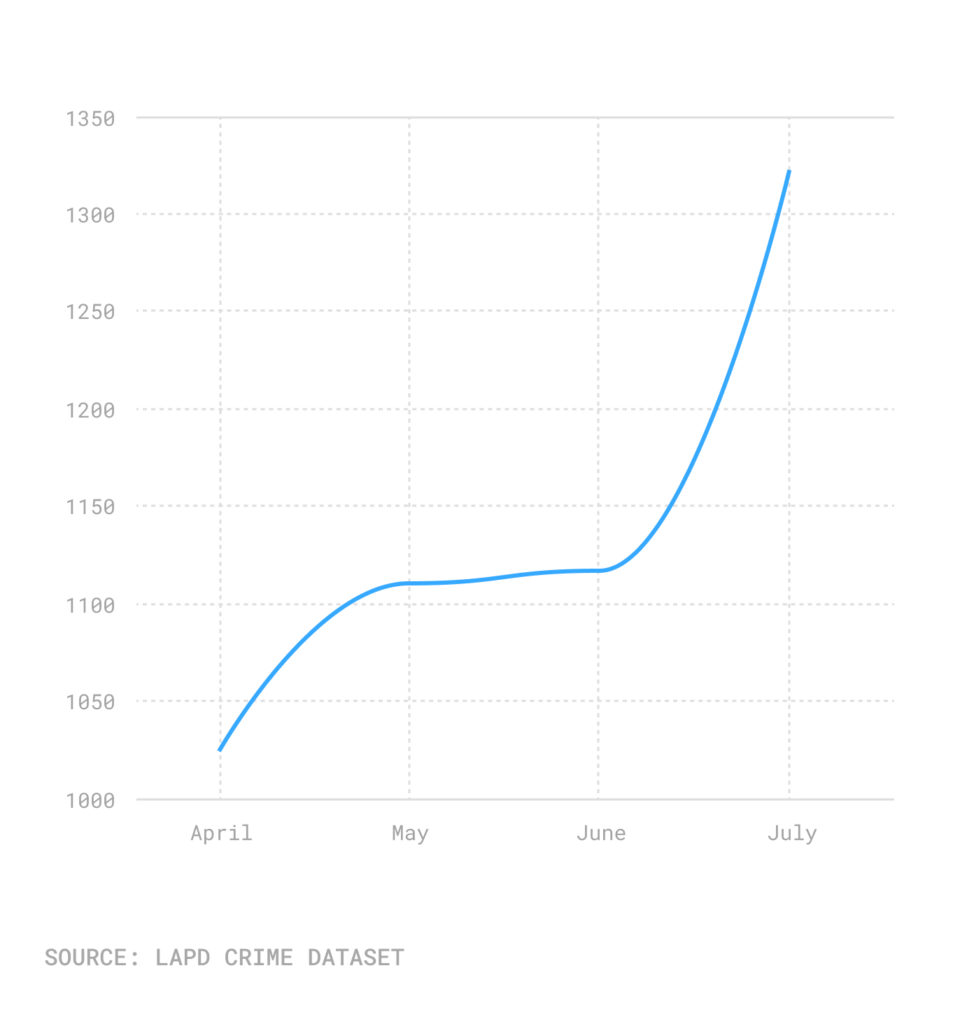
The rise in homicides—both over recent months and in past Julys—was echoed by unsettling increases in other violent crime categories. Aggravated assaults have risen in each of the last three months, and the July count was 29% higher than the April level. July also brought the most aggravated assaults in the city in a single month since at least 2010.
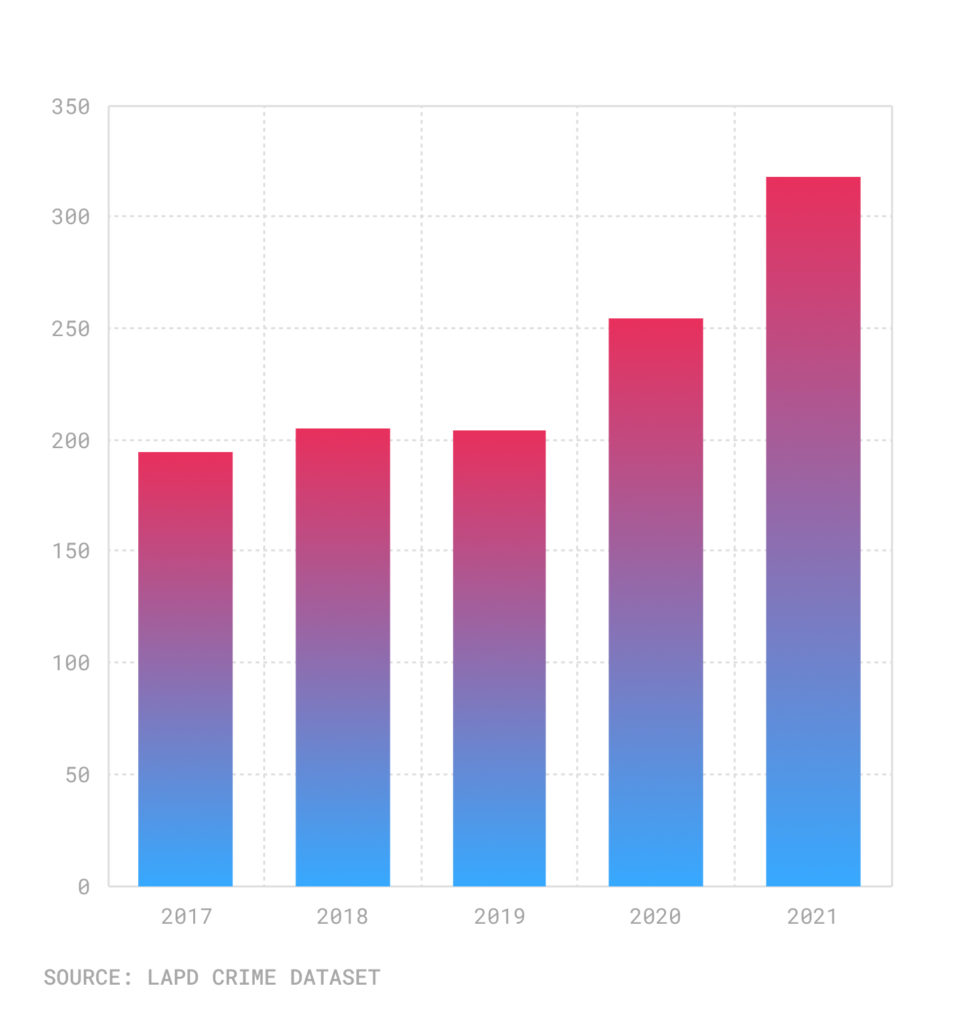
There was more gun activity, too. The 318 shots fired in July marked a 64% increase over the number of shots-fired reports in July 2017.
Aggravated assaults in Los Angeles, April-July 2021
Shots-fired reports in Los Angeles in the month of July, 2017-2021
According to LAPD Compstat figures, through Aug. 21 a total of 18,801 violent crimes had been reported in the city. That is 6.4% higher than in the same time period last year.
[Get COVID-19, crime and other stats about where you live with the Crosstown Neighborhood Newsletter]
Cars gone missing
The trend in property crimes is not as pronounced, but neither is it worth cheering. Los Angeles has seen more than 1,800 stolen vehicles every month from April to July. During that four-month span, 314 cars went missing in Downtown, the highest tally for any neighborhood. Boyle Heights, Koreatown, Westchester and Westlake all also saw more than 200 vehicles go missing in that period.
The 1,874 cars reported stolen last month is below the 2,044 last July, but it is still far above the number of automobiles swiped in the pre-pandemic period of July 2019.
Stolen vehicles in Los Angeles in the month of July, 2017-2021

The 734 robberies in July is well below the 1,028 reported to the LAPD in the same month in 2017. Yet the count is elevated over the figures from April-June.
Robberies in Los Angeles, April-July 2021
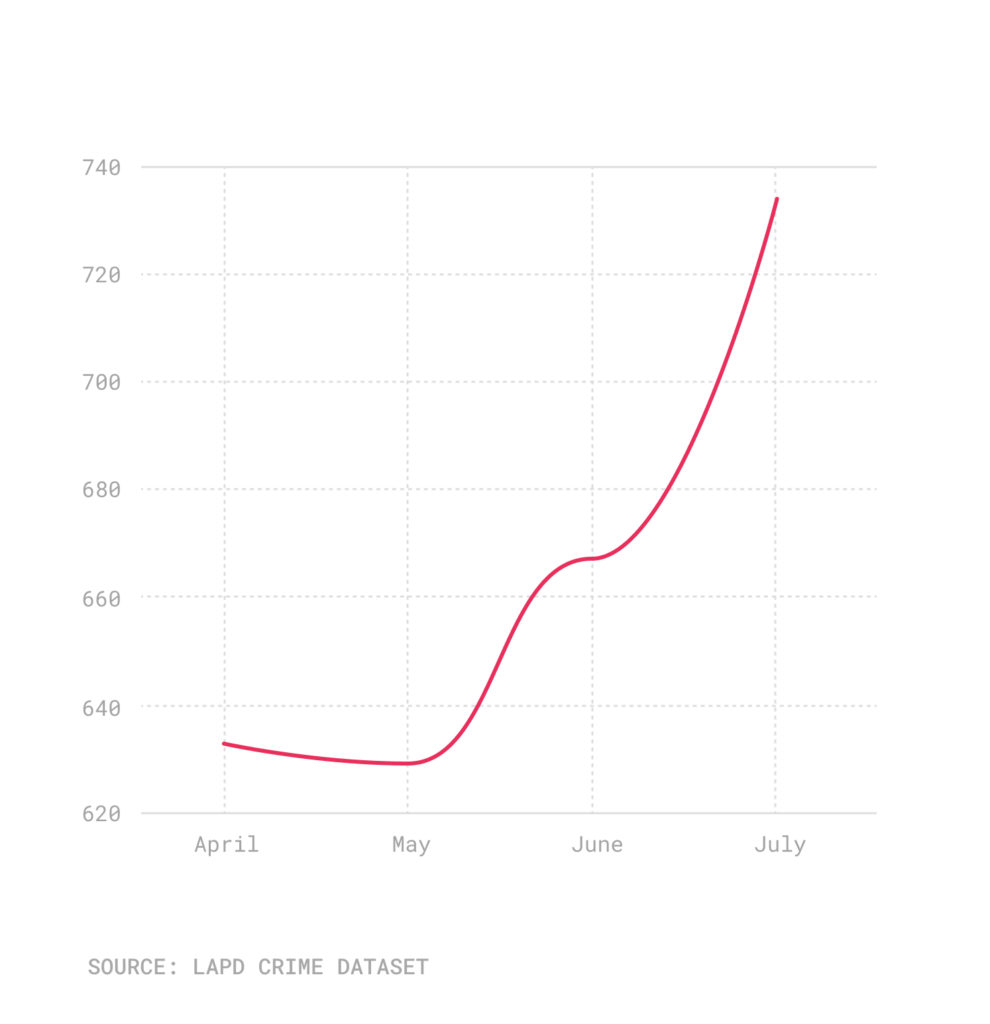
The 87 robberies in Downtown last month made it by far the community with the highest number of incidents reported to the LAPD. Hollywood was a distant second, with 42 robberies.
According to LAPD Compstat figures, the 53,995 overall property crimes through Aug. 21 is 5.3% below the level at the same time last year.
* This story has been updated to reflect new data provided by the LAPD.
How we did it: We examined publicly available crime data from the Los Angeles Police Department from April 1-July 31, 2021, and the periods of July 1-31 from 2017-2021. Learn more about our data here.
LAPD data only reflects crimes that are reported to the department, not how many crimes actually occurred. In making our calculations, we rely on the data the LAPD makes publicly available. LAPD may update past crime reports with new information, or recategorize past reports. Those revised reports do not always automatically become part of the public database.
Want to know how your neighborhood fares? Or simply just interested in our data? Email us at askus@xtown.la.


