

Why Los Angeles can play a dominant role in the recall election


If Gov. Gavin Newsom and the California Democratic party want to beat back the recall, one tactic appears simple: Pump a lot of resources into winning over voters in Los Angeles County.
The same goes for Republican operatives and others seeking to remove Newsom from office. Though they face a built-in disadvantage: the state’s nearly 2 to 1 ratio between registered Democrats and Republicans is even larger in Los Angeles County. It is particularly supersized in the city of L.A.
An examination of publicly available data from the California Secretary of State reveals just how pronounced a role Angelenos can play in the Sept. 14 recall: More than one in four of the 22 million registered voters in the Golden State reside in Los Angeles County. Approximately 2.1 million of them, or 9.7% of those who can cast ballots, live in the city of Los Angeles.
County voter registration numbers and party affiliation breakdown
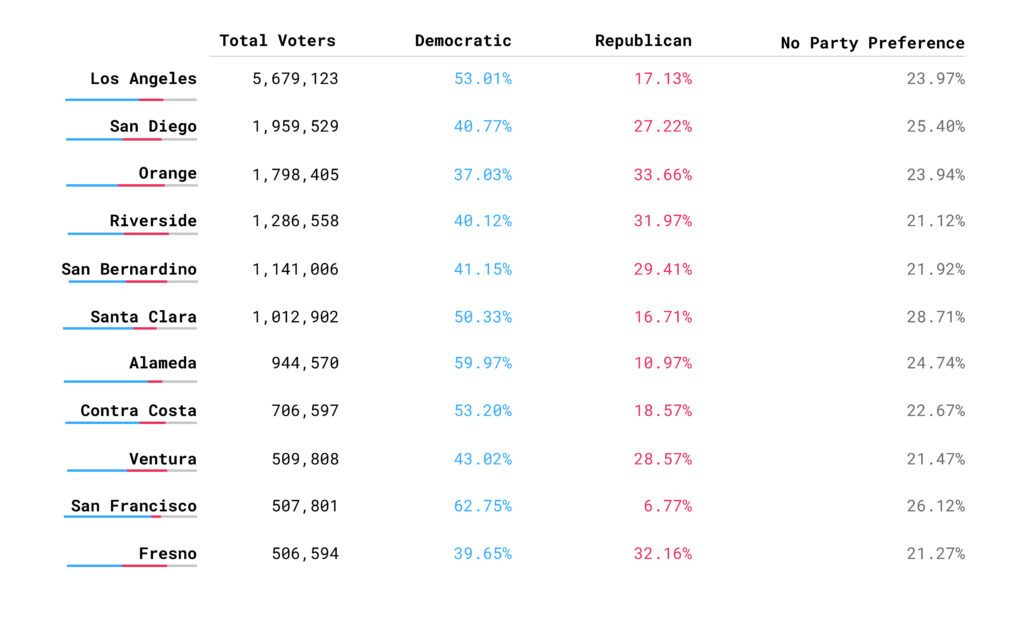
Source: California Secretary of State, as of July 16, 2021
That makes Los Angeles by far the county with the greatest number of people who can drop off a mail-in ballot or hit the polls on election day. In fact, the almost 5.7 million registered voters in Los Angeles County is more than the total of the next three largest counties combined; San Diego, Orange and Riverside counties together have approximately 5 million voters.
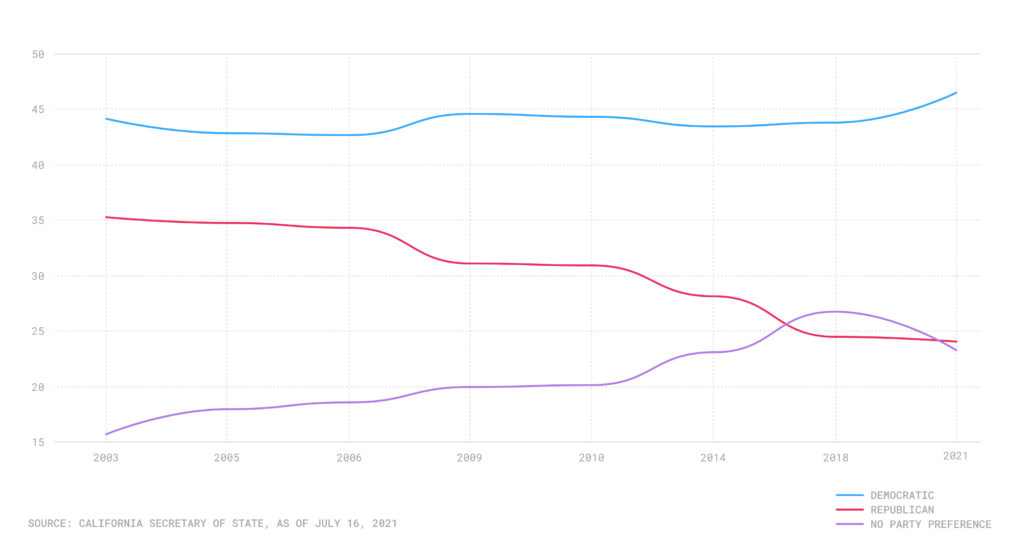
According to the Secretary of State, as of July 16 of this year, 46.5% of voters in the state are registered Democrats, compared with 24.1% who are Republicans. Another 23.3% do not specify a party preference.
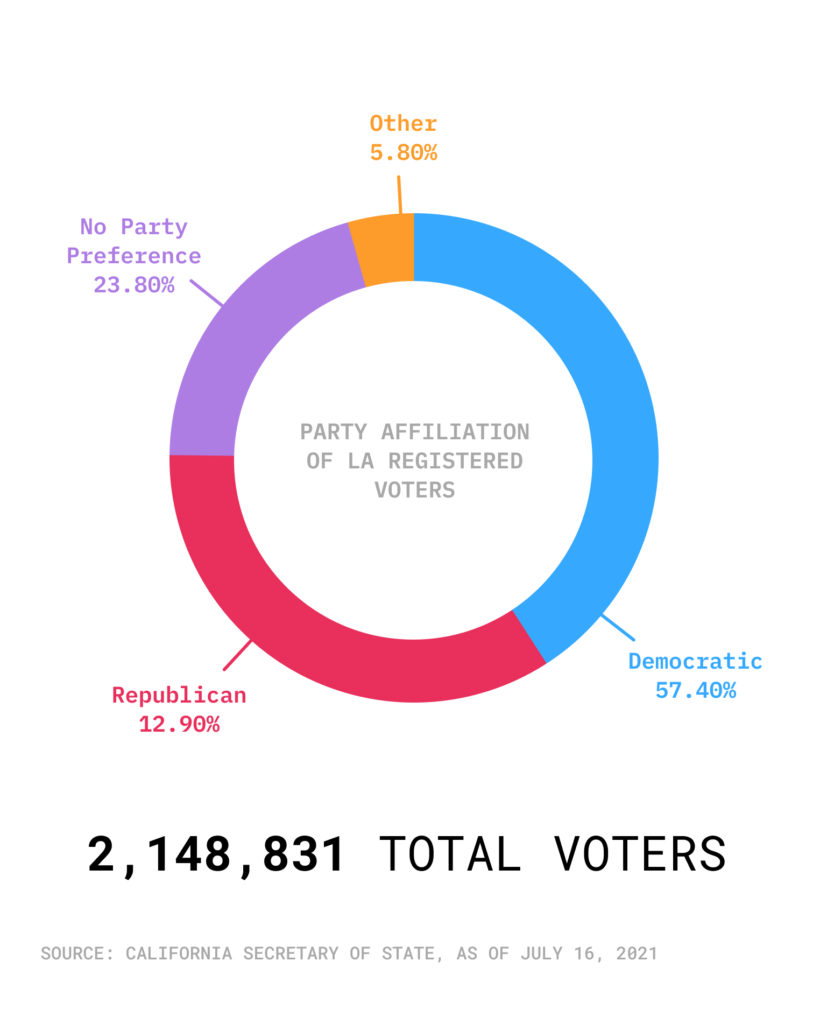
That divide is wider in Los Angeles County, with 53% of voters being registered Democrats, compared with 17% who are Republicans. In the city itself, fewer than one in eight registered voters are Republicans.
Voter registration by party affiliation in the city of Los Angeles
Tracking from the firm Political Data Inc. reveals that through Sept. 1, about 5.05 million ballots had been returned, with 53% of those sent in by Democrats, compared with 22% from Republicans (who tend to show up in higher numbers at polling places). The figures only identify who has submitted ballots, not how they voted, as counting will not commence until election day.
[Get COVID-19, crime and other stats about where you live with the Crosstown Neighborhood Newsletter]
Adding voters
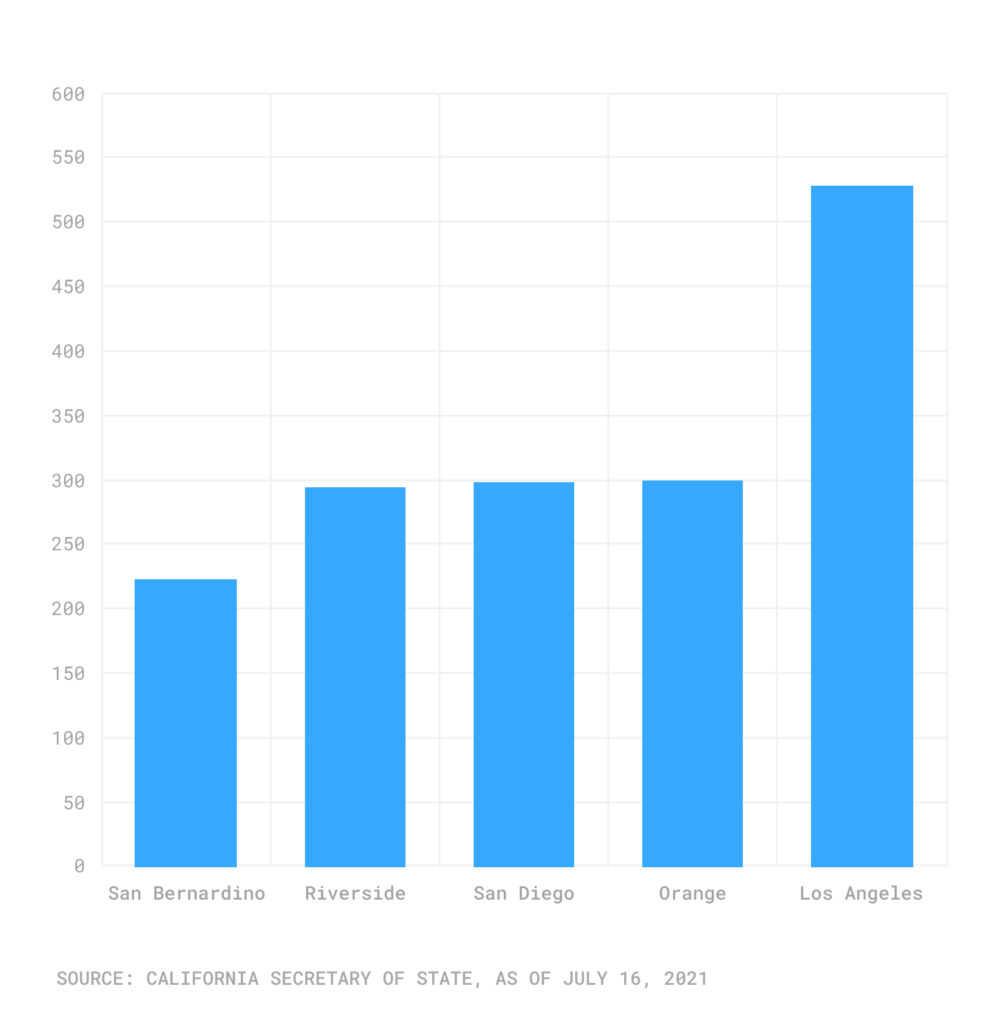
Voter registration trends show another reason why Los Angeles is gaining electoral heft. According to the Secretary of State, since the last gubernatorial election in 2018, Los Angeles County has added 528,000 voters. That far outdistances every other county in California.
California counties with most voters added since 2018
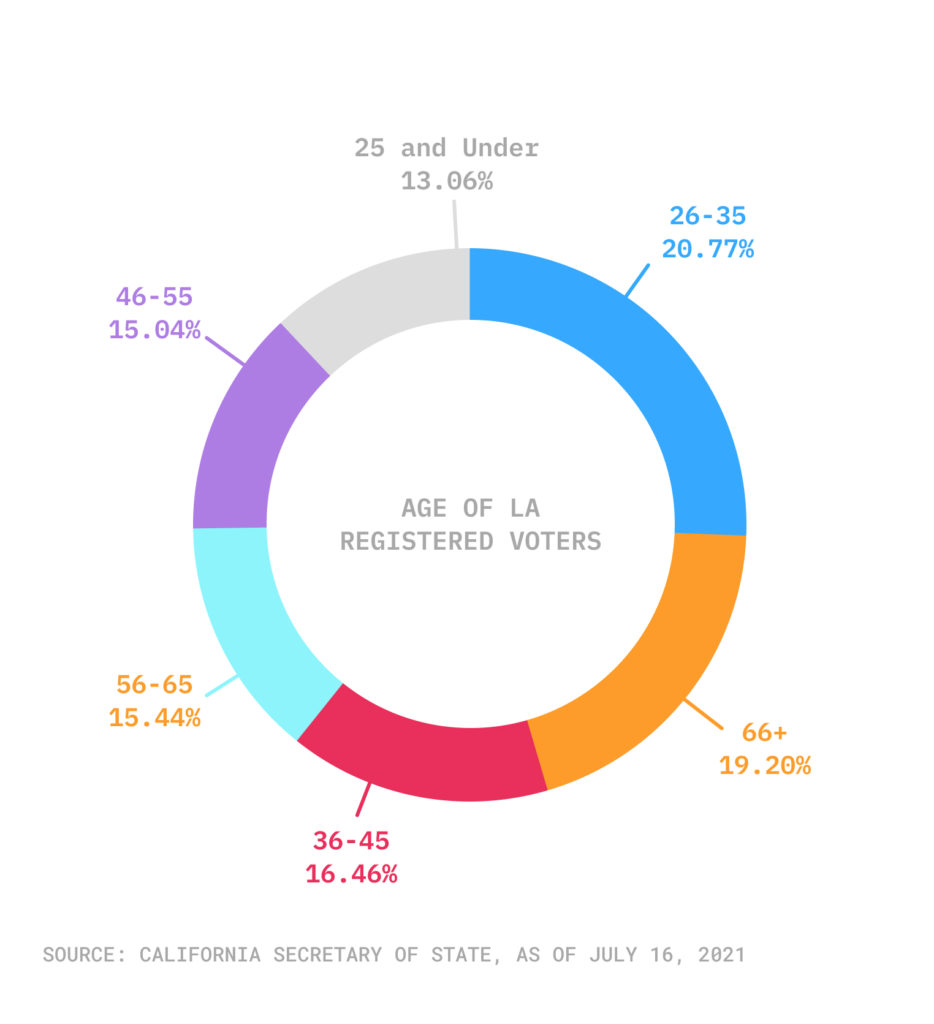
Los Angeles County voter rolls are almost evenly split between those older and younger than 45. Secretary of State data shows that slightly more than 20% of registered voters in the county are 26-35, while an almost similar number are over 65.
Age breakdown of registered voters in Los Angeles County
Despite the discrepancy in party affiliation, those seeking to remove Newsom are hoping that low-propensity Democratic voters will sit out an election in a normally quiet September, while Republicans are motivated by a rare chance to seize a statewide office. If a majority of voters opt to recall Newsom, the second question on the ballot comes into play, with people picking one of 46 candidates. The leading GOP contenders are radio host Larry Elder, former San Diego Mayor Kevin Faulconer, state Assemblyman Kevin Kiley, and bear-toting businessman John Cox.
A Republican has not won a statewide election since 2006, the year Gov. Arnold Schwarzenegger was re-elected. In fact, the percentage of registered Republican voters in California has diminished over the past 18 years, dropping from about 35% at the time of the last recall in 2003, when Gov. Gray Davis was removed from office and Schwarzenegger was installed. In that same timeframe, Democratic party affiliation in the state has remained fairly stable.
Political party registration in California, 2013-2021
Polls close at 8 p.m. on Sept. 14.
How we did it: We examined voter registration data from the office of the California Secretary of State, from 2003-July 16, 2021, as well as election tracking information from the firm Political Data Inc.
Have questions about our data? Contact us at askus@xtown.la.


