

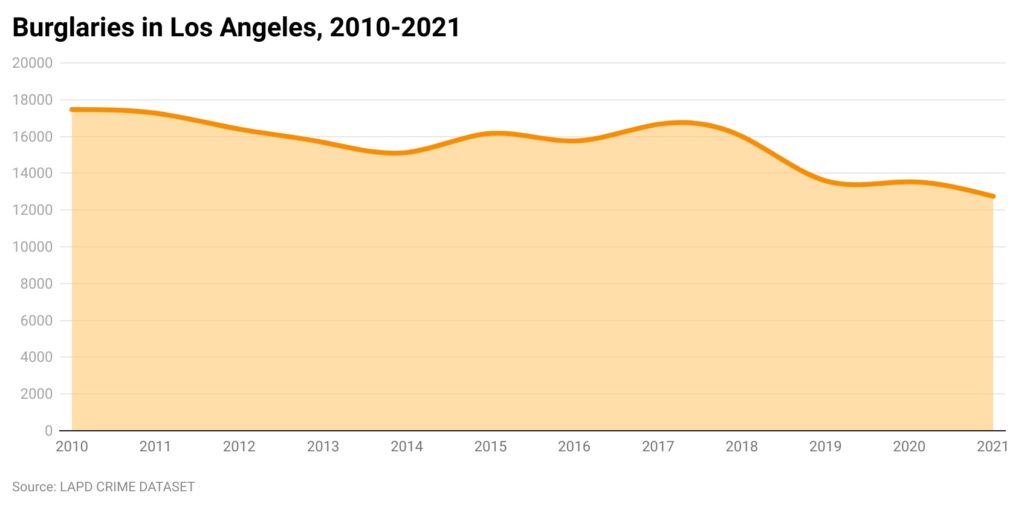
Burglaries continue to fall in Los Angeles


A rise in homicides and shootings in Los Angeles has garnered attention recently, as has a concentration of smash-and-grab crimes at shopping destinations such as The Grove and Melrose Avenue. But largely overlooked has been an overall decline in burglaries.
In 2021, there were 12,747 burglaries reported in the city, a decrease of 6% compared with both 2020 and 2019. Last year’s total is the lowest number since at least 2010, when the Los Angeles Police Department began making its data publicly available.
Downtown recorded the highest burglary rate (the number of burglaries per 100,000 residents), with 1,148. The second most-victimized community was Venice.
Although Hancock Park is known as one of the city’s most exclusive communities, it had the third-highest burglary rate, with 919 crimes per 100,000 people. Affluent neighborhoods often have higher burglary rates than some lower-income areas, likely a result of more people reporting such crimes, as well as thieves targeting wealthier neighborhoods.
Arleta recorded the lowest burglary rate in the city last year, at 86 per 100,000 residents.
People buying guns
Unlike robberies, which involve a theft of someone’s money or other property by threat or force, the majority of burglaries in 2021 occurred in businesses or homes, and the victim may not have even seen the perpetrator (a burglary by definition involves an illegal entry). Neighborhoods including Beverlywood, Beverly Crest and University Park saw a 50% rise in break-ins last year. Mission Hills had a 56% decline.
Vadim Levotman has lived in Beverly Crest for 11 years and serves on the Bel Air-Beverly Crest Neighborhood Council. He said the community has been wanting more police patrols and hired private security last year in response to burglaries in the neighborhood.
He said residents have experienced home break-ins, car thefts and, most recently, a dognapping. Levotman added that some people are even buying guns to protect themselves.
“They are afraid,” he said.
[Get COVID-19, crime and other stats about where you live with the Crosstown Neighborhood Newsletter]
In Beverly Crest, burglaries rose from 29 in 2020 to 44 in 2021. Five years ago, there were 67 burglaries in the community.
Many portions of Los Angeles have seen recent decreases in burglaries. That includes the neighborhoods patrolled by the West Los Angeles Community Police Station. The station’s commanding officer, Capt. Jonathan Tom, said burglaries fell 10.4% in 2021 from the year before.
Still, there are concerns, and Tom said a letter sent to community members this month notified them that thieves have recently been smashing rear glass doors or windows to get into a residence.
He said on a few occasions, suspects were able to break in, but immediately fled when they encountered the occupants.
“People should know that generally speaking, these suspects that are breaking into homes are not looking to confront homeowners,” he said.
Tom said his officers made at least 20 arrests last year, which he believes is partly why the burglary rate in the area has been falling.
See the chart below for the burglary rate in your neighborhood.
| Neighborhoods | Burglaries 2020 | Burglary rate 2020 | Burglaries 2021 | Burglary rate 2021 | Percent change 2021 vs. 2020 | Population (2019) | |
| Downtown | 731 | 1256 | 662 | 1138 | -9% | 58,178 | |
| Venice | 310 | 909 | 351 | 1030 | 13% | 34,088 | |
| Hancock Park | 98 | 948 | 95 | 919 | -3% | 10,337 | |
| Beverly Grove | 260 | 1228 | 180 | 850 | -31% | 21,179 | |
| Windsor Square | 46 | 746 | 45 | 730 | -2% | 6,168 | |
| Fairfax | 170 | 1220 | 98 | 704 | -42% | 13,930 | |
| Larchmont | 45 | 533 | 57 | 675 | 27% | 8,449 | |
| West Los Angeles | 141 | 1049 | 90 | 669 | -36% | 13,446 | |
| Rancho Park | 27 | 530 | 32 | 629 | 19% | 5,091 | |
| Hollywood Hills West | 72 | 483 | 93 | 624 | 29% | 14,900 | |
| Studio City | 217 | 529 | 252 | 614 | 16% | 41,033 | |
| Hollywood | 462 | 647 | 424 | 593 | -8% | 71,451 | |
| Pico Robertson | 94 | 574 | 95 | 580 | 1% | 16,384 | |
| Bel-Air | 42 | 605 | 40 | 577 | -5% | 6,937 | |
| Sawtelle | 256 | 618 | 237 | 572 | -7% | 41,452 | |
| Sherman Oaks | 263 | 368 | 349 | 488 | 33% | 71,493 | |
| Harvard Park | 36 | 364 | 48 | 486 | 33% | 9,885 | |
| Encino | 208 | 438 | 229 | 482 | 10% | 47,527 | |
| Tarzana | 165 | 438 | 181 | 480 | 10% | 37,690 | |
| Brentwood | 145 | 430 | 159 | 471 | 10% | 33,742 | |
| Westchester | 165 | 405 | 190 | 466 | 15% | 40,789 | |
| Carthay | 27 | 523 | 24 | 465 | -11% | 5,162 | |
| Hollywood Hills | 105 | 494 | 96 | 452 | -9% | 21,255 | |
| Playa Del Rey | 41 | 352 | 52 | 446 | 27% | 11,658 | |
| Atwater Village | 44 | 363 | 54 | 445 | 23% | 12,135 | |
| University Park | 69 | 285 | 107 | 441 | 55% | 24,253 | |
| Cheviot Hills | 46 | 591 | 34 | 437 | -26% | 7,784 | |
| Los Feliz | 133 | 411 | 138 | 426 | 4% | 32,391 | |
| Beverly Crest | 29 | 275 | 44 | 418 | 52% | 10,527 | |
| Arlington Heights | 93 | 436 | 89 | 417 | -4% | 21,342 | |
| Beverlywood | 14 | 207 | 27 | 399 | 93% | 6,765 | |
| Century City | 49 | 810 | 24 | 397 | -51% | 6,049 | |
| Canoga Park | 226 | 363 | 245 | 394 | 8% | 62,224 | |
| Valley Village | 89 | 352 | 99 | 392 | 11% | 25,265 | |
| Woodland Hills | 317 | 454 | 271 | 388 | -15% | 69,790 | |
| Toluca Lake | 56 | 585 | 37 | 387 | -34% | 9,568 | |
| Harvard Heights | 79 | 418 | 73 | 387 | -8% | 18,878 | |
| Silver Lake | 143 | 459 | 118 | 379 | -17% | 31,123 | |
| Playa Vista | 82 | 580 | 53 | 375 | -35% | 14,127 | |
| Chesterfield Square | 23 | 277 | 31 | 374 | 35% | 8,292 | |
| North Hollywood | 259 | 327 | 288 | 364 | 11% | 79,093 | |
| Northridge | 228 | 332 | 248 | 361 | 9% | 68,703 | |
| Manchester Square | 33 | 262 | 45 | 358 | 36% | 12,581 | |
| Baldwin Hillscrenshaw | 120 | 396 | 104 | 344 | -13% | 30,276 | |
| Mid City | 193 | 387 | 170 | 341 | -12% | 49,915 | |
| West Adams | 67 | 329 | 68 | 334 | 1% | 20,347 | |
| Wilmington | 203 | 354 | 191 | 333 | -6% | 57,397 | |
| Pacific Palisades | 69 | 292 | 78 | 330 | 13% | 23,636 | |
| Chatsworth | 183 | 339 | 175 | 324 | -4% | 54,006 | |
| Winnetka | 139 | 256 | 174 | 320 | 25% | 54,342 | |
| Mid Wilshire | 198 | 470 | 134 | 318 | -32% | 42,086 | |
| Tujunga | 91 | 337 | 86 | 318 | -5% | 27,037 | |
| Koreatown | 360 | 340 | 334 | 315 | -7% | 106,026 | |
| Historic South Central | 224 | 439 | 160 | 314 | -29% | 50,990 | |
| Hyde Park | 82 | 224 | 112 | 305 | 37% | 36,688 | |
| Pico Union | 133 | 318 | 126 | 301 | -5% | 41,850 | |
| Vermont Slauson | 71 | 238 | 89 | 298 | 25% | 29,836 | |
| Sun Valley | 206 | 294 | 207 | 296 | 0% | 69,957 | |
| Sunland | 52 | 362 | 42 | 293 | -19% | 14,354 | |
| Palms | 144 | 360 | 115 | 287 | -20% | 40,055 | |
| Echo Park | 117 | 335 | 98 | 281 | -16% | 34,926 | |
| Mar Vista | 125 | 336 | 103 | 277 | -18% | 37,235 | |
| Boyle Heights | 264 | 280 | 259 | 275 | -2% | 94,352 | |
| Harbor City | 69 | 266 | 70 | 270 | 1% | 25,926 | |
| Leimert Park | 51 | 404 | 34 | 270 | -33% | 12,613 | |
| Del Rey | 101 | 335 | 81 | 268 | -20% | 30,188 | |
| Shadow Hills | 28 | 200 | 37 | 265 | 32% | 13,972 | |
| Chinatown | 62 | 405 | 40 | 261 | -35% | 15,310 | |
| East Hollywood | 164 | 254 | 168 | 261 | 2% | 64,441 | |
| Vermont Knolls | 73 | 314 | 59 | 254 | -19% | 23,245 | |
| Florence | 130 | 236 | 138 | 251 | 6% | 55,049 | |
| Lake Balboa | 69 | 257 | 67 | 249 | -3% | 26,882 | |
| Broadway Manchester | 93 | 313 | 73 | 246 | -22% | 29,698 | |
| Porter Ranch | 52 | 208 | 60 | 241 | 15% | 24,944 | |
| Van Nuys | 309 | 273 | 271 | 239 | -12% | 113,277 | |
| Central Alameda | 98 | 212 | 110 | 238 | 12% | 46,172 | |
| Valley Glen | 157 | 268 | 139 | 237 | -11% | 58,622 | |
| Westwood | 140 | 255 | 129 | 235 | -8% | 54,940 | |
| San Pedro | 204 | 251 | 190 | 234 | -7% | 81,216 | |
| Granada Hills | 126 | 235 | 124 | 231 | -2% | 53,629 | |
| Lake View Terrace | 25 | 183 | 31 | 227 | 24% | 13,649 | |
| Reseda | 171 | 232 | 167 | 227 | -2% | 73,657 | |
| Adams Normandie | 29 | 154 | 40 | 213 | 38% | 18,801 | |
| Vermont Square | 99 | 186 | 117 | 219 | 18% | 53,365 | |
| Westlake | 260 | 231 | 245 | 218 | -6% | 112,373 | |
| Mission Hills | 94 | 489 | 41 | 213 | -56% | 19,208 | |
| Panorama City | 97 | 140 | 142 | 206 | 46% | 69,078 | |
| Harbor Gateway | 167 | 393 | 87 | 205 | -48% | 42,450 | |
| West Hills | 82 | 202 | 82 | 202 | 0% | 40,553 | |
| Vermont Vista | 69 | 256 | 53 | 197 | -23% | 26,908 | |
| Gramercy Park | 28 | 259 | 21 | 194 | -25% | 10,819 | |
| Elysian Park | 5 | 186 | 5 | 186 | 0% | 2,690 | |
| Lincoln Heights | 46 | 158 | 54 | 185 | 17% | 29,114 | |
| Elysian Valley | 23 | 304 | 14 | 185 | -39% | 7,566 | |
| Eagle Rock | 75 | 215 | 63 | 180 | -16% | 34,914 | |
| Glassell Park | 46 | 193 | 40 | 167 | -13% | 23,893 | |
| North Hills | 91 | 140 | 106 | 163 | 16% | 64,913 | |
| Exposition Park | 77 | 211 | 56 | 153 | -27% | 36,502 | |
| Jefferson Park | 37 | 142 | 40 | 153 | 8% | 26,123 | |
| Green Meadows | 100 | 276 | 50 | 138 | -50% | 36,168 | |
| South Park | 70 | 196 | 48 | 134 | -31% | 35,749 | |
| Mount Washington | 17 | 120 | 19 | 134 | 12% | 14,168 | |
| Pacoima | 141 | 179 | 94 | 120 | -33% | 78,654 | |
| Montecito Heights | 29 | 149 | 23 | 118 | -21% | 19,466 | |
| Sylmar | 126 | 157 | 92 | 114 | -27% | 80,443 | |
| Cypress Park | 28 | 286 | 11 | 112 | -61% | 9,778 | |
| Highland Park | 83 | 159 | 54 | 104 | -35% | 52,082 | |
| El Sereno | 77 | 183 | 42 | 100 | -45% | 42,154 | |
| Watts | 74 | 166 | 42 | 94 | -43% | 44,696 | |
| Arleta | 30 | 83 | 31 | 86 | 3% | 36,094 |
How we did it: We examined publicly available crime data from the Los Angeles Police Department. Learn more about our data here.
LAPD data only reflects crimes that are reported to the department, not how many crimes actually occurred. In making our calculations, we rely on the data the LAPD makes publicly available. LAPD may update past crime reports with new information, or recategorize past reports. Those revised reports do not always automatically become part of the public database.
Want to know how your neighborhood fares? Or simply just interested in our data? Email us at askus@xtown.la.


