

Some L.A. neighborhoods saw COVID cases increase 30-fold in one month


Los Angeles, like much of the rest of the country, was ravaged by the recent Omicron spike. But the surge was not felt equally in the region, continuing a trend seen since the early days of the pandemic.
Virtually every community in Los Angeles saw the number of new coronavirus cases at least triple during a one-month period. But in some South Los Angeles neighborhoods and other low-income areas, the increase was more than 30-fold.
In the period from Nov. 22-Dec. 21, before the full onslaught of the Omicron wave, 50,449 new coronavirus cases were recorded in Los Angeles County. From Dec. 22-Jan. 21, 858,514 new cases were identified. That is a 1,600% increase countywide in just one month.
Many of the communities hit hardest were in South Los Angeles.
Neighborhoods with the greatest percentage rise in COVID-19 cases
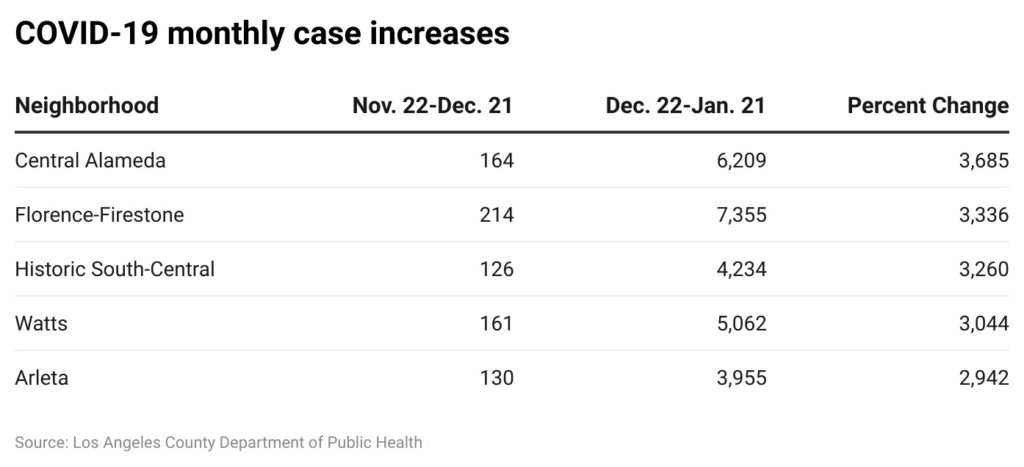
Central Alameda recorded 164 new cases from Nov. 22-Dec. 21. In the following month, the community with an estimated 44,000 residents recorded 6,209 new cases. That was an increase of more than 3,600%.
Watts experienced 161 cases from Nov. 22-Dec. 21. In the following month, there were 5,062 new cases, a rise of 3,000%.
Other neighborhoods that far outpaced the countywide increase included Historic South-Central, which saw a nearly 3,200% rise, and Florence-Firestone, an unincorporated community, where the increase was more than 3,300%. Pacoima, in the east San Fernando Valley, went from 288 cases one month to 8,530 the next, an increase of more than 2,860%.
Rising everywhere
Although there was widespread illness and medical facilities were strained, communities where the number of cases increased by less than 700% in a one-month period appeared to be faring “better.”
[Get COVID-19, crime and other stats about where you live with the Crosstown Neighborhood Newsletter]
Consider West Hollywood. It went from 535 cases from Nov. 22-Dec. 21, to 2,484 new cases in the next month. That was “just” a 364% jump.
Other neighborhoods with a case rate increase well below the countywide benchmark included affluent areas such as Santa Monica (a 665% rise, from 817 cases from Nov. 22-Dec. 21 to 6,256 the next month) and Beverly Hills (a 553% increase)
From the onset of the pandemic, low-income communities of color have experienced the greatest devastation from COVID-19 in Los Angeles County and across the United States.
On Jan. 20, the Los Angeles County Department of Public Health reported that there were 3,600 COVID-19 cases per 100,000 Latinx people in the region, and Black county residents had a rate of 2,700 cases per 100,000 inhabitants.
Those figures compared with a rate of 2,300 cases per 100,000 Asian county inhabitants, and 2,100 infections per 100,000 white residents.
Hospitalizations showed a similar pattern, as Black and Latinx residents were hospitalized at higher rates than white and Asian inhabitants.
“The higher rates of cases, hospitalizations, and deaths among Black and Latinx residents is a tragedy that reflects both longstanding inequities to the resources that promote good health and policies and practices that marginalize the concerns of people of color,” said L.A. County Director of Public Health Dr. Barbara Ferrer in a prepared statement.
The disparity extends to vaccinations. According to the Department of Public Health’s vaccine dashboard, as of Feb. 3, 87.6% of Asian county residents had received at least one shot, as had 77.7% of white inhabitants. That outpaced the 64.9% of Latinx residents who had gotten at least one dose. The vaccination rate for Black county residents is just 59.4%
| Neighborhood | Nov. 22 | Dec. 21 | Case increase from Nov. 22-Dec. 21 | Dec. 22 | Jan. 21 | Case increase from Dec.22-Jan. 21 | Percent Change |
| central-alameda | 12465 | 12629 | 164 | 12691 | 18900 | 6209 | 36.8597561 |
| florence-firestone | 15354 | 15568 | 214 | 15622 | 22977 | 7355 | 33.36915888 |
| historic-south-central | 8494 | 8620 | 126 | 8660 | 12894 | 4234 | 32.6031746 |
| watts | 8915 | 9076 | 161 | 9129 | 14191 | 5062 | 30.44099379 |
| arleta | 8017 | 8147 | 130 | 8187 | 12142 | 3955 | 29.42307692 |
| pacoima | 19530 | 19818 | 288 | 19907 | 28437 | 8530 | 28.61805556 |
| cudahy | 5454 | 5564 | 110 | 5598 | 8669 | 3071 | 26.91818182 |
| panorama-city | 15475 | 15757 | 282 | 15824 | 23585 | 7761 | 26.5212766 |
| huntington-park | 12603 | 12830 | 227 | 12894 | 19049 | 6155 | 26.11453744 |
| vermont-square | 13500 | 13750 | 250 | 13844 | 20503 | 6659 | 25.636 |
| florence | 10695 | 10927 | 232 | 10993 | 17027 | 6034 | 25.00862069 |
| wilmington | 10092 | 10344 | 252 | 10400 | 16915 | 6515 | 24.8531746 |
| north-hills | 11003 | 11244 | 241 | 11310 | 17531 | 6221 | 24.81327801 |
| maywood | 5874 | 5991 | 117 | 6012 | 8988 | 2976 | 24.43589744 |
| boyle-heights | 19556 | 19903 | 347 | 20002 | 28788 | 8786 | 24.31988473 |
| broadway-manchester | 12002 | 12275 | 273 | 12345 | 19243 | 6898 | 24.26739927 |
| green-meadows | 12002 | 12275 | 273 | 12345 | 19243 | 6898 | 24.26739927 |
| south-gate | 21672 | 22104 | 432 | 22222 | 33035 | 10813 | 24.03009259 |
| westmont | 7850 | 8037 | 187 | 8090 | 12523 | 4433 | 22.70588235 |
| east-los-angeles | 28197 | 28747 | 550 | 28878 | 41900 | 13022 | 22.67636364 |
| bell | 7698 | 7865 | 167 | 7895 | 11812 | 3917 | 22.45508982 |
| monterey-park | 5726 | 5888 | 162 | 5956 | 9742 | 3786 | 22.37037037 |
| sun-valley | 11078 | 11310 | 232 | 11382 | 16777 | 5395 | 22.25431034 |
| rosemead | 5710 | 5848 | 138 | 5905 | 9097 | 3192 | 22.13043478 |
| willowbrook | 9318 | 9518 | 200 | 9570 | 14123 | 4553 | 21.765 |
| san-fernando | 6122 | 6252 | 130 | 6293 | 9235 | 2942 | 21.63076923 |
| south-park | 8439 | 8629 | 190 | 8657 | 12951 | 4294 | 21.6 |
| chesterfield-square | 8476 | 8667 | 191 | 8713 | 13010 | 4297 | 21.4973822 |
| harvard-park | 8476 | 8667 | 191 | 8713 | 13010 | 4297 | 21.4973822 |
| vermont-slauson | 8476 | 8667 | 191 | 8713 | 13010 | 4297 | 21.4973822 |
| lawndale | 4383 | 4501 | 118 | 4550 | 7201 | 2651 | 21.46610169 |
| van-nuys | 17215 | 17613 | 398 | 17725 | 26591 | 8866 | 21.27638191 |
| carson | 12454 | 12869 | 415 | 13009 | 22252 | 9243 | 21.27228916 |
| sylmar | 19067 | 19521 | 454 | 19665 | 29512 | 9847 | 20.68942731 |
| monrovia | 4151 | 4280 | 129 | 4347 | 7140 | 2793 | 20.65116279 |
| vermont-vista | 10589 | 10836 | 247 | 10891 | 16224 | 5333 | 20.59109312 |
| bell-gardens | 9178 | 9313 | 135 | 9349 | 12234 | 2885 | 20.37037037 |
| mission-hills | 5197 | 5339 | 142 | 5381 | 8401 | 3020 | 20.26760563 |
| winnetka | 8219 | 8446 | 227 | 8510 | 13283 | 4773 | 20.02643172 |
| compton | 20200 | 20623 | 423 | 20722 | 29614 | 8892 | 20.0212766 |
| lincoln-heights | 5898 | 6032 | 134 | 6083 | 8884 | 2801 | 19.90298507 |
| montecito-heights | 5898 | 6032 | 134 | 6083 | 8884 | 2801 | 19.90298507 |
| el-monte | 19403 | 19822 | 419 | 19951 | 28606 | 8655 | 19.65632458 |
| downey | 20990 | 21478 | 488 | 21622 | 31637 | 10015 | 19.52254098 |
| el-sereno | 7608 | 7818 | 210 | 7890 | 12183 | 4293 | 19.44285714 |
| pico-union | 7932 | 8109 | 177 | 8166 | 11751 | 3585 | 19.25423729 |
| south-whittier | 9908 | 10142 | 234 | 10214 | 14933 | 4719 | 19.16666667 |
| baldwin-park | 14889 | 15149 | 260 | 15243 | 20431 | 5188 | 18.95384615 |
| norwalk | 18910 | 19390 | 480 | 19536 | 29088 | 9552 | 18.9 |
| harbor-gateway | 6109 | 6321 | 212 | 6364 | 10538 | 4174 | 18.68867925 |
| west-whittier-los-nietos | 4978 | 5087 | 109 | 5121 | 7245 | 2124 | 18.48623853 |
| harbor-city | 3543 | 3685 | 142 | 3716 | 6446 | 2730 | 18.22535211 |
| westlake | 11295 | 11644 | 349 | 11770 | 18333 | 6563 | 17.80515759 |
| san-pedro | 10019 | 10388 | 369 | 10539 | 17462 | 6923 | 17.76151762 |
| diamond-bar | 4137 | 4317 | 180 | 4370 | 7744 | 3374 | 17.74444444 |
| hyde-park | 5085 | 5261 | 176 | 5344 | 8638 | 3294 | 17.71590909 |
| west-adams | 8967 | 9252 | 285 | 9360 | 14676 | 5316 | 17.65263158 |
| long-beach | 66672 | 68879 | 2207 | 69384 | 110471 | 41087 | 17.61667422 |
| hacienda-heights | 6217 | 6413 | 196 | 6482 | 10114 | 3632 | 17.53061224 |
| west-covina | 15654 | 16151 | 497 | 16332 | 25510 | 9178 | 17.4668008 |
| lynwood | 15261 | 15585 | 324 | 15651 | 21601 | 5950 | 17.36419753 |
| bellflower | 13274 | 13641 | 367 | 13734 | 20451 | 6717 | 17.30245232 |
| exposition-park | 7414 | 7652 | 238 | 7721 | 12069 | 4348 | 17.26890756 |
| porter-ranch | 3451 | 3589 | 138 | 3661 | 6174 | 2513 | 17.21014493 |
| chatsworth | 4995 | 5168 | 173 | 5227 | 8377 | 3150 | 17.20809249 |
| paramount | 11591 | 11850 | 259 | 11908 | 16600 | 4692 | 17.11583012 |
| arcadia | 3499 | 3666 | 167 | 3725 | 6748 | 3023 | 17.10179641 |
| north-el-monte | 3499 | 3666 | 167 | 3725 | 6748 | 3023 | 17.10179641 |
| lake-balboa | 6681 | 6893 | 212 | 6962 | 10750 | 3788 | 16.86792453 |
| west-carson | 2815 | 2915 | 100 | 2944 | 4723 | 1779 | 16.79 |
| pomona | 30088 | 30885 | 797 | 31070 | 45237 | 14167 | 16.77540778 |
| canoga-park | 11209 | 11541 | 332 | 11627 | 17524 | 5897 | 16.76204819 |
| hawthorne | 13274 | 13663 | 389 | 13826 | 20714 | 6888 | 16.70694087 |
| pico-rivera | 12834 | 13128 | 294 | 13214 | 18400 | 5186 | 16.63945578 |
| reseda | 14713 | 15147 | 434 | 15271 | 22904 | 7633 | 16.5875576 |
| la-puente | 7625 | 7812 | 187 | 7853 | 11108 | 3255 | 16.40641711 |
| gardena | 8079 | 8403 | 324 | 8493 | 14112 | 5619 | 16.34259259 |
| koreatown | 16400 | 16967 | 567 | 17242 | 27013 | 9771 | 16.23280423 |
| granada-hills | 8370 | 8672 | 302 | 8778 | 13945 | 5167 | 16.10927152 |
| rowland-heights | 4292 | 4461 | 169 | 4504 | 7365 | 2861 | 15.92899408 |
| south-diamond-bar | 4292 | 4461 | 169 | 4504 | 7365 | 2861 | 15.92899408 |
| whittier | 13458 | 13849 | 391 | 13978 | 20580 | 6602 | 15.88491049 |
| cerritos | 3987 | 4170 | 183 | 4255 | 7301 | 3046 | 15.64480874 |
| san-gabriel | 3790 | 3929 | 139 | 3970 | 6280 | 2310 | 15.61870504 |
| alhambra | 8429 | 8762 | 333 | 8919 | 14390 | 5471 | 15.42942943 |
| inglewood | 17131 | 17648 | 517 | 17867 | 26356 | 8489 | 15.41972921 |
| west-puente-valley | 4926 | 5050 | 124 | 5087 | 7117 | 2030 | 15.37096774 |
| northridge | 9601 | 9990 | 389 | 10103 | 16447 | 6344 | 15.30848329 |
| walnut | 2201 | 2307 | 106 | 2343 | 4066 | 1723 | 15.25471698 |
| baldwin-hillscrenshaw | 3691 | 3849 | 158 | 3912 | 6476 | 2564 | 15.2278481 |
| valinda | 4385 | 4514 | 129 | 4548 | 6616 | 2068 | 15.03100775 |
| azusa | 7611 | 7870 | 259 | 7938 | 12073 | 4135 | 14.96525097 |
| torrance | 10112 | 10645 | 533 | 10835 | 19318 | 8483 | 14.91557223 |
| san-dimas | 4111 | 4277 | 166 | 4329 | 6952 | 2623 | 14.80120482 |
| la-mirada | 5532 | 5737 | 205 | 5802 | 9027 | 3225 | 14.73170732 |
| valley-glen | 4789 | 4965 | 176 | 5024 | 7742 | 2718 | 14.44318182 |
| mid-city | 8365 | 8751 | 386 | 8932 | 14700 | 5768 | 13.94300518 |
| lakewood | 9698 | 10110 | 412 | 10204 | 16336 | 6132 | 13.88349515 |
| montebello | 11739 | 12068 | 329 | 12133 | 16991 | 4858 | 13.76595745 |
| rancho-palos-verdes | 2225 | 2348 | 123 | 2392 | 4208 | 1816 | 13.76422764 |
| east-hollywood | 5222 | 5413 | 191 | 5493 | 8300 | 2807 | 13.69633508 |
| stevenson-ranch | 1863 | 1964 | 101 | 2007 | 3489 | 1482 | 13.67326733 |
| pasadena | 13809 | 14399 | 590 | 14695 | 23265 | 8570 | 13.52542373 |
| north-hollywood | 25920 | 26870 | 950 | 27210 | 40993 | 13783 | 13.50842105 |
| eagle-rock | 4510 | 4716 | 206 | 4805 | 7747 | 2942 | 13.2815534 |
| glassell-park | 4142 | 4321 | 179 | 4378 | 6884 | 2506 | 13 |
| highland-park | 6819 | 7110 | 291 | 7233 | 11234 | 4001 | 12.74914089 |
| covina | 7920 | 8258 | 338 | 8367 | 12991 | 4624 | 12.68047337 |
| burbank | 11646 | 12158 | 512 | 12383 | 19284 | 6901 | 12.47851563 |
| leimert-park | 2115 | 2220 | 105 | 2258 | 3658 | 1400 | 12.33333333 |
| altadena | 4213 | 4418 | 205 | 4494 | 7214 | 2720 | 12.26829268 |
| glendora | 6175 | 6462 | 287 | 6535 | 10276 | 3741 | 12.03484321 |
| tujunga | 3740 | 3888 | 148 | 3926 | 5852 | 1926 | 12.01351351 |
| university-park | 4316 | 4524 | 208 | 4582 | 7265 | 2683 | 11.89903846 |
| cypress-park | 3356 | 3507 | 151 | 3548 | 5449 | 1901 | 11.58940397 |
| mount-washington | 3356 | 3507 | 151 | 3548 | 5449 | 1901 | 11.58940397 |
| redondo-beach | 4333 | 4645 | 312 | 4783 | 8700 | 3917 | 11.55448718 |
| santa-clarita | 28463 | 29855 | 1392 | 30210 | 47685 | 17475 | 11.55387931 |
| castaic-canyons | 1865 | 1974 | 109 | 1999 | 3364 | 1365 | 11.52293578 |
| green-valley | 1865 | 1974 | 109 | 1999 | 3364 | 1365 | 11.52293578 |
| palmdale | 31076 | 32189 | 1113 | 32359 | 46172 | 13813 | 11.41060198 |
| chatsworth-reservoir | 4238 | 4481 | 243 | 4576 | 7512 | 2936 | 11.08230453 |
| west-hills | 4238 | 4481 | 243 | 4576 | 7512 | 2936 | 11.08230453 |
| glendale | 25581 | 26613 | 1032 | 26985 | 39165 | 12180 | 10.80232558 |
| south-pasadena | 1776 | 1900 | 124 | 1963 | 3418 | 1455 | 10.73387097 |
| la-canada-flintridge | 1153 | 1256 | 103 | 1288 | 2488 | 1200 | 10.65048544 |
| castaic | 4619 | 4763 | 144 | 4797 | 6467 | 1670 | 10.59722222 |
| hasley-canyon | 4619 | 4763 | 144 | 4797 | 6467 | 1670 | 10.59722222 |
| ridge-route | 4619 | 4763 | 144 | 4797 | 6467 | 1670 | 10.59722222 |
| la-verne | 3697 | 3900 | 203 | 3934 | 6269 | 2335 | 10.50246305 |
| westchester | 3760 | 4055 | 295 | 4204 | 7576 | 3372 | 10.43050847 |
| culver-city | 3050 | 3315 | 265 | 3434 | 6335 | 2901 | 9.947169811 |
| echo-park | 8092 | 8475 | 383 | 8619 | 12790 | 4171 | 9.890339426 |
| el-segundo | 1137 | 1240 | 103 | 1302 | 2417 | 1115 | 9.825242718 |
| sunland | 2846 | 2981 | 135 | 3007 | 4467 | 1460 | 9.814814815 |
| claremont | 3206 | 3404 | 198 | 3451 | 5588 | 2137 | 9.792929293 |
| mar-vista | 3043 | 3299 | 256 | 3445 | 6178 | 2733 | 9.67578125 |
| tarzana | 4315 | 4518 | 203 | 4569 | 6726 | 2157 | 9.625615764 |
| woodland-hills | 7191 | 7632 | 441 | 7784 | 12414 | 4630 | 9.498866213 |
| palms | 3577 | 3860 | 283 | 3996 | 6893 | 2897 | 9.236749117 |
| atwater-village | 1778 | 1895 | 117 | 1921 | 3090 | 1169 | 8.991452991 |
| hermosa-beach | 1649 | 1766 | 117 | 1823 | 2929 | 1106 | 8.452991453 |
| del-rey | 2779 | 3005 | 226 | 3094 | 5214 | 2120 | 8.380530973 |
| lancaster | 29888 | 31218 | 1330 | 31413 | 43683 | 12270 | 8.22556391 |
| calabasas | 1874 | 2012 | 138 | 2078 | 3344 | 1266 | 8.173913043 |
| westwood | 3901 | 4297 | 396 | 4440 | 8047 | 3607 | 8.108585859 |
| encino | 4727 | 5124 | 397 | 5243 | 8839 | 3596 | 8.057934509 |
| sepulveda-basin | 4727 | 5124 | 397 | 5243 | 8839 | 3596 | 8.057934509 |
| mid-wilshire | 4421 | 4778 | 357 | 4927 | 8082 | 3155 | 7.837535014 |
| downtown | 15043 | 15950 | 907 | 16224 | 24184 | 7960 | 7.776185226 |
| hancock-park | 1483 | 1616 | 133 | 1676 | 2841 | 1165 | 7.759398496 |
| windsor-square | 1483 | 1616 | 133 | 1676 | 2841 | 1165 | 7.759398496 |
| agoura-hills | 1521 | 1644 | 123 | 1677 | 2739 | 1062 | 7.634146341 |
| sherman-oaks | 8549 | 9311 | 762 | 9607 | 16078 | 6471 | 7.492125984 |
| manhattan-beach | 2202 | 2415 | 213 | 2510 | 4301 | 1791 | 7.408450704 |
| topanga | 1094 | 1216 | 122 | 1266 | 2281 | 1015 | 7.319672131 |
| unincorporated-santa-monica-mountains | 1094 | 1216 | 122 | 1266 | 2281 | 1015 | 7.319672131 |
| silver-lake | 4350 | 4751 | 401 | 4907 | 8187 | 3280 | 7.179551122 |
| valley-village | 2925 | 3166 | 241 | 3237 | 5208 | 1971 | 7.178423237 |
| sawtelle | 3422 | 3751 | 329 | 3923 | 6525 | 2602 | 6.90881459 |
| west-los-angeles | 3422 | 3751 | 329 | 3923 | 6525 | 2602 | 6.90881459 |
| beverlywood | 1344 | 1479 | 135 | 1526 | 2593 | 1067 | 6.903703704 |
| fairfax | 10350 | 11077 | 727 | 11362 | 17096 | 5734 | 6.887207703 |
| larchmont | 10350 | 11077 | 727 | 11362 | 17096 | 5734 | 6.887207703 |
| playa-vista | 949 | 1064 | 115 | 1125 | 2018 | 893 | 6.765217391 |
| santa-monica | 7050 | 7867 | 817 | 8264 | 14520 | 6256 | 6.657282742 |
| pacific-palisades | 1442 | 1627 | 185 | 1712 | 3097 | 1385 | 6.486486486 |
| pico-robertson | 1362 | 1490 | 128 | 1533 | 2480 | 947 | 6.3984375 |
| brentwood | 2448 | 2764 | 316 | 2936 | 5179 | 2243 | 6.098101266 |
| griffith-park | 2755 | 3027 | 272 | 3145 | 5069 | 1924 | 6.073529412 |
| los-feliz | 2755 | 3027 | 272 | 3145 | 5069 | 1924 | 6.073529412 |
| studio-city | 2073 | 2277 | 204 | 2364 | 3804 | 1440 | 6.058823529 |
| hollywood | 7938 | 8627 | 689 | 8978 | 13827 | 4849 | 6.037735849 |
| beverly-hills | 3735 | 4165 | 430 | 4335 | 7146 | 2811 | 5.537209302 |
| beverly-crest | 938 | 1075 | 137 | 1141 | 2002 | 861 | 5.284671533 |
| beverly-grove | 2369 | 2648 | 279 | 2788 | 4447 | 1659 | 4.946236559 |
| carthay | 2369 | 2648 | 279 | 2788 | 4447 | 1659 | 4.946236559 |
| venice | 3135 | 3566 | 431 | 3753 | 6303 | 2550 | 4.916473318 |
| quartz-hill | 1776 | 1910 | 134 | 1928 | 2712 | 784 | 4.850746269 |
| hollywood-hills | 2443 | 2753 | 310 | 2876 | 4510 | 1634 | 4.270967742 |
| hollywood-hills-west | 2443 | 2753 | 310 | 2876 | 4510 | 1634 | 4.270967742 |
| west-hollywood | 3762 | 4297 | 535 | 4521 | 7005 | 2484 | 3.642990654 |
How we did it: We examined publicly available data on daily COVID-19 infections from the Los Angeles County Department of Public Health. We then tallied the number of new infections in 272 communities in the county from Nov. 22 and compared that against the new infections recorded between Dec. 21 -Jan. 22. We then narrowed our ranking down to communities that recorded 100 or more new infections between Nov. 22 and Dec. 21. That reduced the number of communities we surveyed to 183.
Crosstown uses neighborhood boundaries defined by the Los Angeles Times. In some instances, the Los Angeles County Department of Public Health refers to areas that have different boundaries. We have adjusted our boundaries to conform to the Department of Public Health when possible. In several cases, the department’s boundary definition is unclear. We did not include data for communities when there was uncertainty about the boundary.
Have questions about our data? Write to us at askus@xtown.la.


