

The Crosstown COVID Tracker


When it comes to the coronavirus pandemic, positive indicators continue to spread across Los Angeles. Hospitalizations are below 400, a level not seen since last summer. Daily case rates and deaths are declining.
That leads to various forms of progress. The Los Angeles Unified School District went mask-optional on Wednesday. Additionally, state health officials plan to lift the requirements for vaccine and test verification at mega-events beginning April 1.
Despite all the progress and optimism, health officials remain cautious as the BA.2 subvariant—estimated to be 30%-60% more infectious than the Omicron variant—gradually spreads in Los Angeles County. It is impossible to tell if another surge will come, and if so, how severe it will be.
The Crosstown COVID Tracker helps you stay up to date on the latest and most important data on infections, inoculations and general risk. Information on cases in individual communities is available on the Crosstown coronavirus interactive map.
More open hospital beds
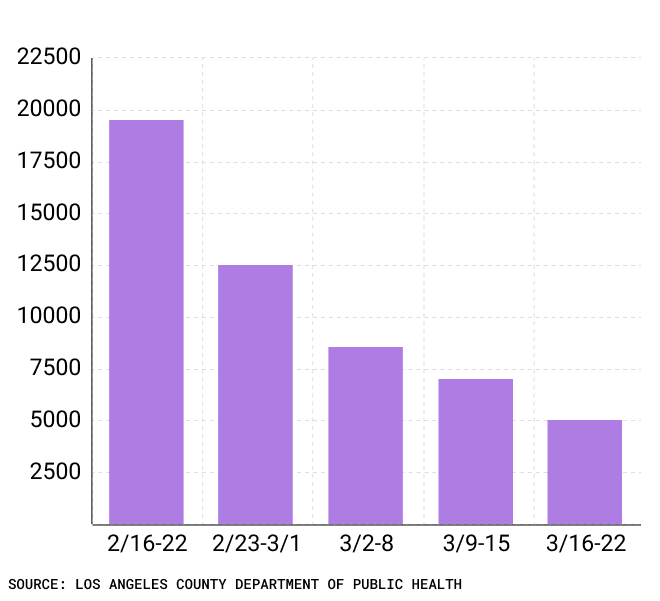
New daily cases continue to drop, and have remained below 1,000 since Friday, according to the Los Angeles County Department of Public Health. On Wednesday the seven-day average of new cases was 694. That is a 27.3% decrease from the week before.
Only two months ago, on Jan. 23, the seven-day average stood at 33,566 cases.
Weekly COVID-19 cases in Los Angeles County, Feb. 16-March 22
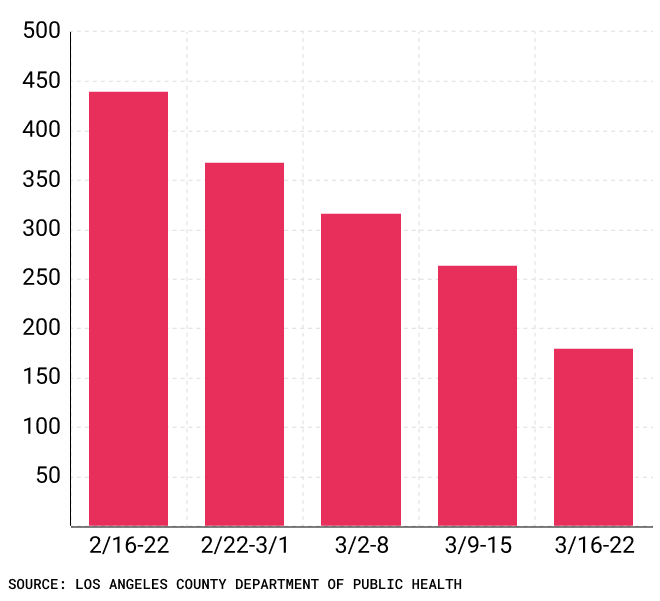
Deaths also continue to fall, and are nearing levels not seen since before the Omicron surge. On Tuesday, the Department of Public Health reported 17 COVID-19 fatalities, the lowest daily number in more than two months.
On Wednesday, the seven-day average of deaths was 25. Last week it was 35.
Weekly COVID-19 deaths in Los Angeles County, Feb. 16-March 22
Perhaps the most important metric is hospitalizations, as health leaders use the figure to determine what steps can be taken without straining the regional healthcare system. There were 378 patients hospitalized with COVID-19 on Wednesday, the lowest number since July 13.
COVID-19 hospitalizations in Los Angeles County, Jan. 1-March 22

The daily test positivity rate also remains markedly low, indicating very limited community spread. On Wednesday, the rate of tests coming back positive in the county was 0.7%.
The Los Angeles Unified School District, which tests students and staff weekly, also is seeing a minute level of transmission. From March 16-22, the district detected 481 positive cases among the 307,448 tests administered. That works out to a positivity rate of 0.16%.
[Get COVID-19, crime and other stats about where you live with the Crosstown Neighborhood Newsletter]
The boosters slow down
It’s become a mantra: Vaccines and booster shots are the best way to prevent coronavirus infection. The theme is being hit again as worry over the subvariant rises.
In Los Angeles County, more than 95% of residents over the age of 65 have received at least one dose, and 90% are fully protected. Through March 3, 82.9% of residents 5 and up had received at least one dose with nearly 75% of them being fully vaccinated.
However, booster shots are going into arms at a frustratingly slow pace. Out of approximately 10 million county residents, only 3.69 million have received an additional dose.
Altogether, 18,072,574 jabs have been given in the county. At this time last year, 3,794,829 shots had been administered, and 25.5% of residents 12 and up had received at least one shot.
According to the state of California’s COVID-19 tracking page, from Feb. 28-March 6, unvaccinated residents were 4.4 times more likely to contract the coronavirus than boosted individuals. From Feb. 21-27, unvaccinated individuals were 13.8 times more likely to die from COVID-19 than their protected counterparts.
How we did it: We analyzed coronavirus data related to new cases, deaths, hospitalizations and vaccinations provided by the Los Angeles County Department of Public Health, as well as data from the Los Angeles Unified School District.
Interested in our data? Check out the Crosstown coronavirus interactive map or email askus@xtown.la.


