

The Crosstown COVID Tracker


![]()
Last week, Los Angeles County experienced something that had not happened since mid-January: The weekly number of new COVID-19 cases increased. Health officials attribute the rise to the spread of the highly contagious BA.2 subvariant.
On Wednesday, the seven-day average of new cases was 835. That’s a 23.2% increase from the previous week.
Weekly COVID-19 cases in Los Angeles County, March 2-April 5
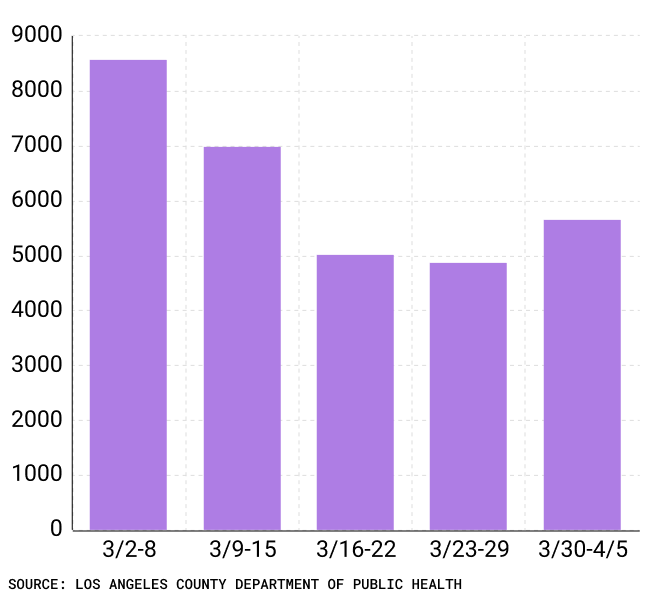
Still, the situation is far better than earlier this year. In January there were sometimes more than 40,000 cases diagnosed per day. Two months ago, the seven-day average was 14,383.
The Crosstown COVID Tracker helps you stay up to date on the latest and most important data on infections, inoculations and general risk. Information on cases in individual communities is available on the Crosstown coronavirus interactive map.
Figures not seen since July
Although case numbers have ticked up slightly, they remain relatively low. The county surpassed 1,000 new cases last Friday and Saturday, but that was the first time in four figures since March 17. Other metrics have yet to show an increase from BA.2, which is estimated to be 30%-60% more contagious than Omicron.
Deaths, which spiked in recent months, have declined to pre-Omicron levels. On Wednesday, the Los Angeles County Department of Public Health reported 17 fatalities. The seven-day average of deaths on Wednesday was 13. It was 19 one week ago.
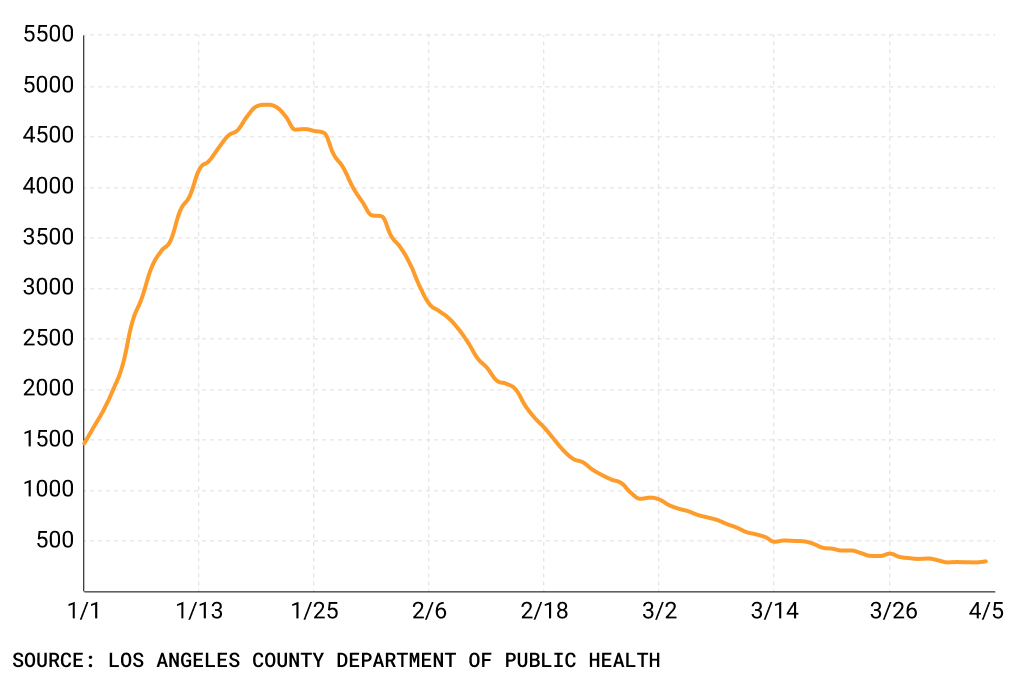
Hospitalizations are also tumbling. Last Friday, the number of people hospitalized with the coronavirus dipped below 300 for the first time since July 8. On Wednesday, there were 292 COVID-19 patients in county hospitals.
Two months ago, 2,841 COVID-positive individuals were being treated in area medical institutions.
COVID-19 hospitalizations in Los Angeles County, Jan. 1-April 5
Transmission is following a similar pattern. On Wednesday, the test positivity rate in the county stood at 1%.
The positivity rate, case numbers and outbreaks also remain low on Los Angeles Unified School District campuses, where students and staff continue to be tested weekly. From March 30–April 5, the LAUSD reported 607 positive cases among the 352,090 tests administered. This works out to a 0.17% positivity rate.
[Get COVID-19, crime and other stats about where you live with the Crosstown Neighborhood Newsletter]
Plenty of shots available
Despite the constant push from health and elected officials for vaccines and boosters, inoculation levels have dipped in Los Angeles County.
Currently, there are more than 2.6 million booster-eligible residents who have not received their extra dose (not to mention the fourth shot of the Pfizer and Moderna vaccines now available for people over 50). Additionally, nearly 1.7 million eligible Angelenos have not taken even a first dose.
Although a sizable number of people have clearly opted not to be vaccinated, the Department of Public Health is seeking to close the gap in coverage. This week there will be more than 700 mobile vaccine clinics in the county, many of which will be deployed to under-resourced communities.
For the week ending March 18, unvaccinated residents in Los Angeles County were six times more likely to be hospitalized than their vaccinated and boosted counterparts.
An estimated 18,216,513 shots have been administered to residents since vaccines started going into arms. One year ago today, the number of jabs stood at 4,913,321.
Through April 1, 83.1% of county residents 5 and up had received at least one vaccine dose. The rate of individuals 5 and up who are fully vaccinated has remained at 75% for nearly a month.
How we did it: We analyzed coronavirus data related to new cases, deaths, hospitalizations and vaccinations provided by the Los Angeles County Department of Public Health, as well as data from the Los Angeles Unified School District.
Interested in our data? Check out the Crosstown coronavirus interactive map or email askus@xtown.la.


