

The Crosstown COVID Tracker


![]()
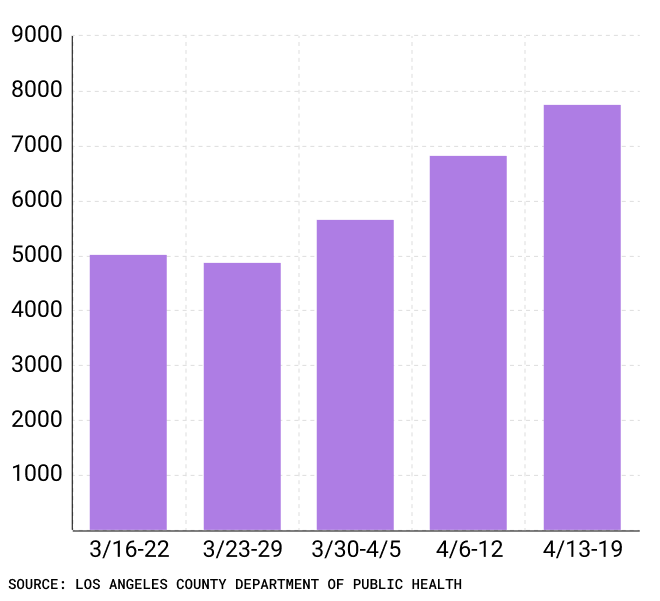
After months of improving conditions, coronavirus case numbers are on the rise. With the BA.2 subvariant emerging as the predominant strain in Los Angeles County, the seven-day average of new cases surpassed 1,000 this week. That level had not been seen in more than a month.
On Wednesday, the seven-day average of cases hit 1,132. That’s a 13.3% increase from last week.
Weekly COVID-19 cases in Los Angeles County, March 16-April 19
Although restrictions have been tightened in some other cities, the strain on the regional healthcare system remains low, and the Los Angeles County Department of Public Health has relaxed requirements for asymptomatic people who have had close contact with a COVID-positive person. These individuals no longer need to isolate after possible exposure, regardless of vaccine status. However, health officials recommend that anyone in this situation tests soon after exposure and wears a mask when indoors around others.
The Crosstown COVID Tracker provides the latest and most important data on infections, inoculations and general risk. Information on cases in individual communities is available on the Crosstown coronavirus interactive map.
A low in hospitalizations
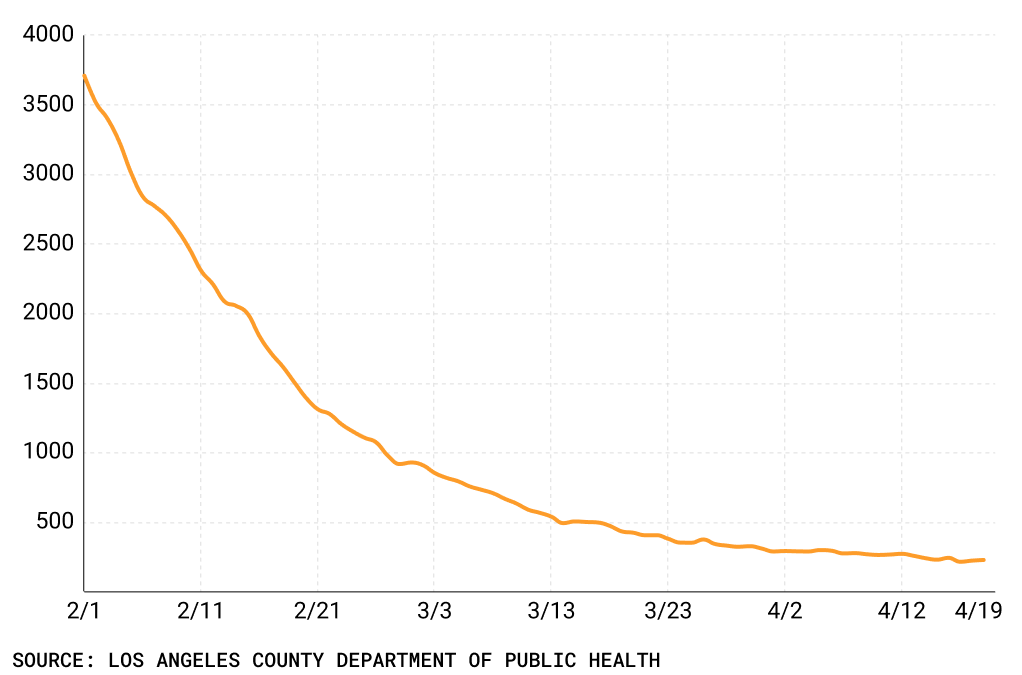
Although cases are on the rise, hospitalizations in Los Angeles County have remained below 300 since the start of April. On Wednesday, 230 COVID-19 patients were receiving treatment in area hospitals—the last time figures were this low was in late June. Last week, there were 256 hospitalized residents.
COVID-19 hospitalizations in Los Angeles County, Feb. 1-April 19
Deaths are also lower than they have been in months. On Wednesday, the Department of Public Health reported 15 COVID-19 deaths. The seven-day average of deaths was 10 on Wednesday, down slightly from 11 last week.
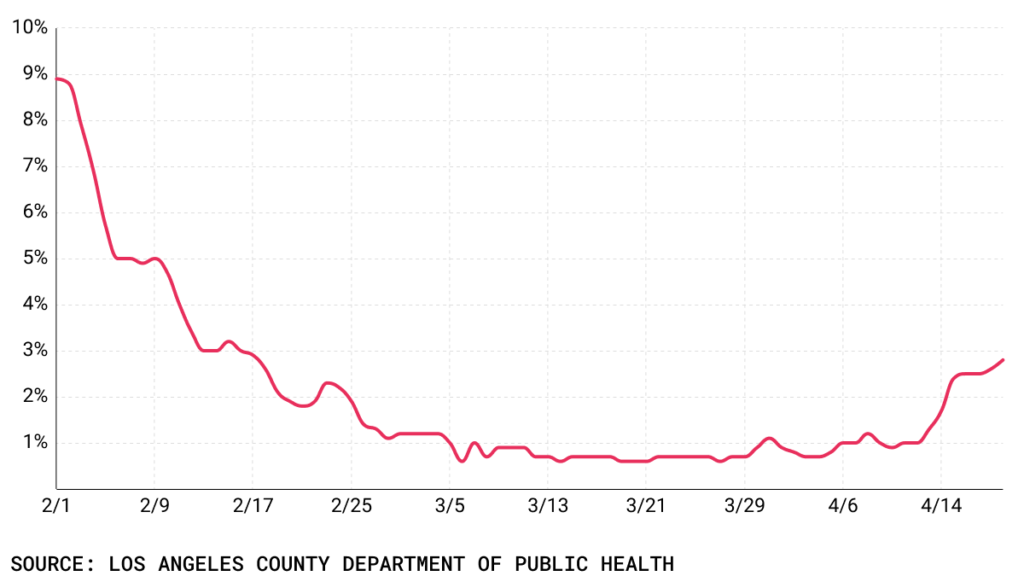
One area of concern is the positivity rate. After being mostly at or below 1% for more than a month, it has crept up in the last 10 days and has been above 2% since Friday. On Wednesday, the positivity rate stood at 2.5%.
COVID-19 positivity rate, Feb. 1-April 19
Increased circulation of BA.2 has produced a slight increase in cases and outbreaks at Los Angeles Unified School District facilities. From April 13-19, there were 881 positive results out of the 155,413 tests administered (test numbers are lower than usual due to the recent LAUSD spring break). The positivity rate reached 0.57%, up from 0.22% the previous week.
The Department of Public Health continues to work with the district to ensure vaccines are easily accessible to staff and students. Over the next two weeks, there will be more than 240 vaccine clinics at county schools.
[Get COVID-19, crime and other stats about where you live with the Crosstown Neighborhood Newsletter]
Vaccine disparity
Rising case numbers have done little to propel more people to get inoculated. Out of 9.7 million eligible county residents 5 and up, there are nearly 1.6 million unvaccinated individuals. More than 5.9 million residents have yet to receive a booster dose.
According to the State of California’s COVID-19 tracking page, from March 22-28, unvaccinated residents were 4.6 times more likely to contract COVID-19 than boosted individuals. Additionally, unvaccinated people were 9.6 times more likely to die from COVID-19 than boosted Californians.
As has been the case for nearly a year, there continues to be a wide discrepancy in vaccination rates among people of different ethnic groups. Data through April 14 shows that 82.3% of Asian or Asian-American Angelenos and 73.6% of white residents were fully vaccinated. This compares with 59.3% of Latinx residents and 55.9% of African-American Angelenos who were fully vaccinated through April 14.
In Los Angeles County, approximately 18,427,388 shots have been administered. One year ago, the total number of vaccines was 6,641,945.
Through April 14, 83.3% of residents 5 and up had received at least one vaccine dose. Nearly 75% are fully vaccinated.
How we did it: We analyzed coronavirus data related to new cases, deaths, hospitalizations and vaccinations provided by the Los Angeles County Department of Public Health, as well as data from the Los Angeles Unified School District.
Interested in our data? Check out the Crosstown coronavirus interactive map or email askus@xtown.la.


