

The month in COVID: September


Over the past two-and-a-half years, COVID-19 figures in Los Angeles County have fluctuated significantly. One thing is for sure: Even if the worst has long passed, the coronavirus will continue to be a part of life in the region for the foreseeable future.
September brought generally steady improvement, as the summer surge propelled by the BA.4 and BA.5 variants continued to ease. This resulted in additional relaxing of masking and social distancing restrictions.
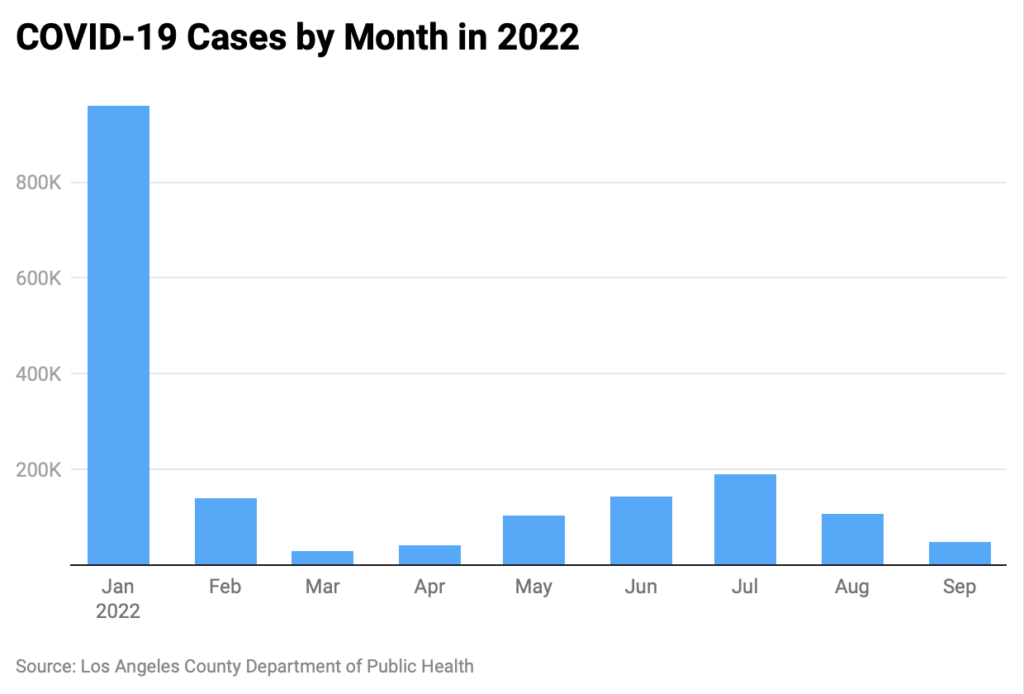
The Los Angeles County Department of Public Health reported 48,032 new cases in September, marking a 54.6% decline from the previous month. The daily peak was the 2,705 infections on Sept. 2. The low was the 691 cases reported on Sept. 26.
The current situation stands in sharp contrast to the spike last winter.
The monthly trend closely mirrors the COVID-19 situation in September 2021. It is impossible to know what is coming, but last year cases continued to drop in early fall, with the seven-day average hitting a low of 830 cases on Nov. 28.
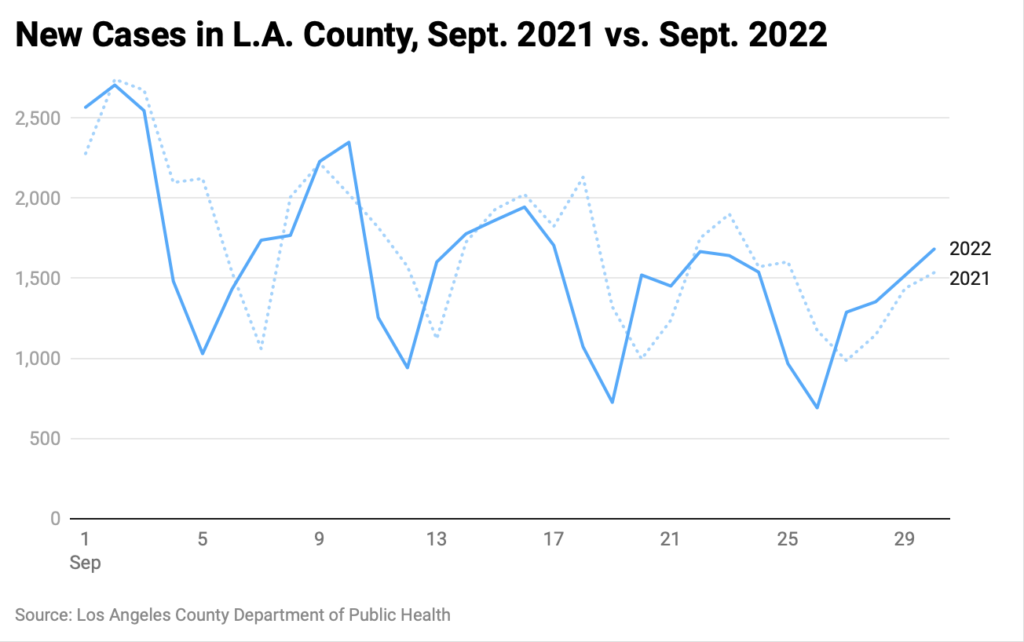
Of course, things can change quickly. Omicron roared as people gathered over the winter holidays, and on Jan. 15 the seven-day average climbed to 41,689 cases (though deaths and hospitalizations never ascended to pre-vaccination levels). In short, do not get too comfortable.
[Get COVID-19, crime and other stats about where you live with the Crosstown Neighborhood Newsletter]
Positivity rate and hospitalizations
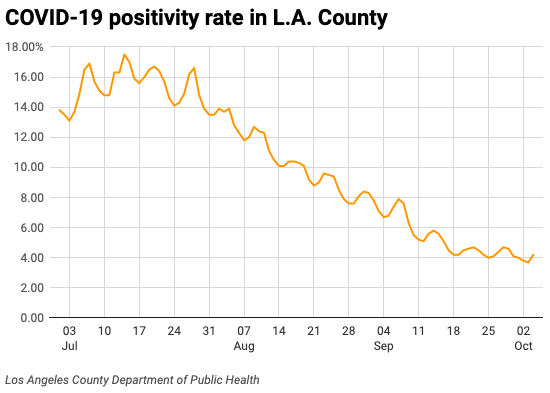
The positivity rate consistently declined during September, continuing a trend. On July 14, the rate hit 17.5%, and it remained consistently above 10% until mid-August. On Sept. 1 the rate was 8.3%, according to the Department of Public Health. On Sept. 30 it sat at 4.1%.
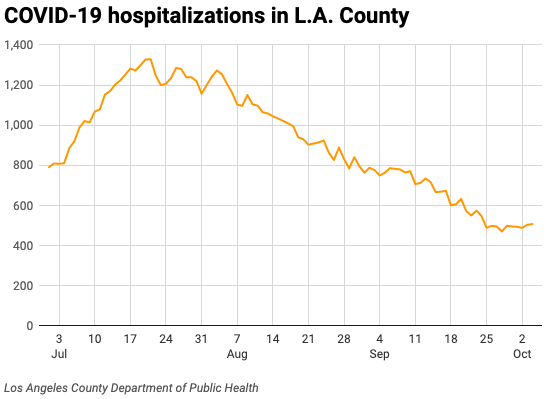
Hospitalizations also decreased during September, falling to levels not seen since May.
On Sept. 1, the Department of Public Health reported that 764 people were hospitalized with COVID-19 in the county (that was already an improvement from the more than 1,200 hospitalizations reported throughout July). At the close of September, 496 patients were in area medical institutions.
The average number of hospitalizations per day in September was 655.
Health and political leaders continue to stress that being vaccinated can protect against the worst impacts of the coronavirus. The numbers give weight to their claim: Since the beginning of the pandemic, 20,310 vaccinated county residents have been hospitalized. That is only 0.29% of vaccinated individuals.
Deaths
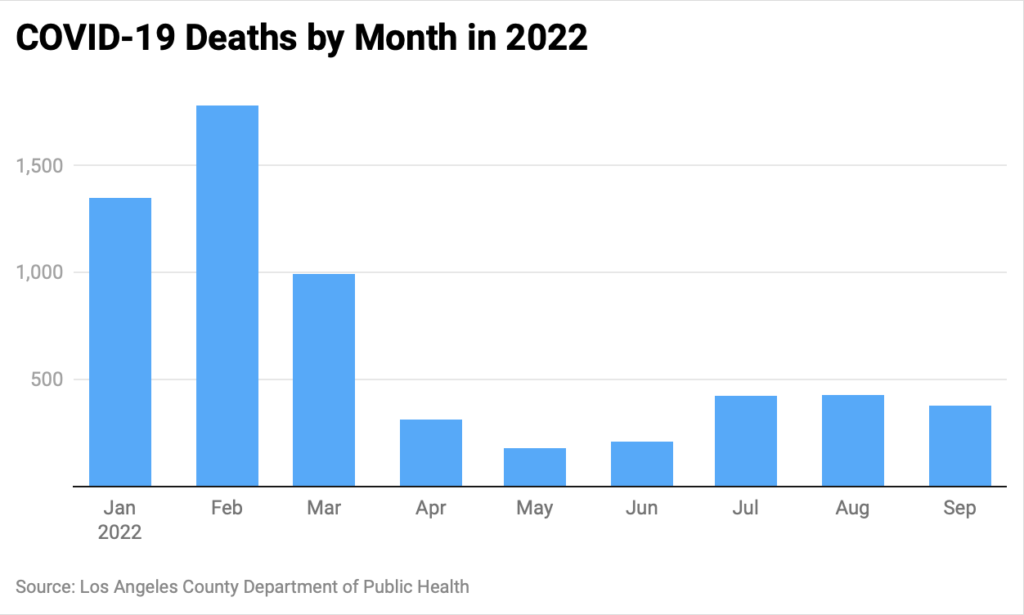
The ultimate impact of COVID-19 cannot be overstated. Through Sept. 30, the Department of Public Health recorded 33,603 deaths due to the virus.
Approximately 374 Angelenos died of COVID-19 in September, a 12.2% decrease from August. The number of daily deaths peaked at 17 on Sept. 10.
For context, there were approximately 1,285 COVID-19 fatalities in Los Angeles County in January.
Vaccinations
On Aug. 31, the Centers for Disease Control and Prevention approved new bivalent vaccines that protect against original COVID-19 strains as well as Omicron variants. The shot is available to any resident 12 and older who is two months out from their last dose.
Despite the added protection these shots provide, there appears to have been no rush to the pharmacies.
Countywide vaccination rates peaked in March 2021, when more than 1.7 million Angelenos got jabbed. By March 2022, the figure dropped to 46,784. In August 32,900 shots were administered.
According to Department of Public Health data, just 12,853 doses were administered in September. However, that could change; county totals are through Sept. 29, and there can be a lag in reporting.
How we did it: We analyzed coronavirus data related to new cases, deaths, hospitalizations and vaccinations provided by the Los Angeles County Department of Public Health.
Interested in our data? Check out the Crosstown coronavirus interactive map or email askus@xtown.la.


