

5 things to know about COVID-19 this week


![]()
On Monday, Gov. Gavin Newsom announced plans to end the COVID-19 state of emergency in California that was declared in March 2020. The change will go into effect on Feb. 28, 2023, allowing for a possible winter surge (and a hopeful fast recovery). The decision, Newsom said, stems from the significant decline in coronavirus-caused deaths and hospitalizations. The move will also allow the state to divert funds elsewhere.
Every week, Crosstown details how Los Angeles County is faring in the ongoing battle against COVID-19. Here is the latest.
1) A boost for children
On Oct. 12, the Centers for Disease Control and Prevention approved use of the updated bivalent vaccine for children ages 5 and older. It protects against the original strain of the virus and the dominant Omicron BA.4 and BA.5 subvariants.
The pediatric booster by Moderna is currently available in Los Angeles County, and Pfizer doses are also rolling out. This booster is seen as essential for schoolchildren, who often gather unmasked in large numbers. Additionally, their previous shots may be less effective during the winter.
To be eligible for the shot, children must have received the last of their first two doses at least two months ago. Yet the uptake may not be swift: According to the Los Angeles County Department of Public Health, out of nearly 900,000 children ages 5-11 in the county, more than 500,000 have not completed their primary vaccination series.
[Get COVID-19, crime and other stats about where you live with the Crosstown Neighborhood Newsletter]
2) Fewer infections
Is this the end of the pandemic, or the calm before the next storm? That is unknown, but for the moment, the number of new COVID-19 cases in Los Angeles County continues to decline. From Oct. 12–18, the Department of Public Health reported 6,674 infections. This is an 8.5% decrease from one week prior.
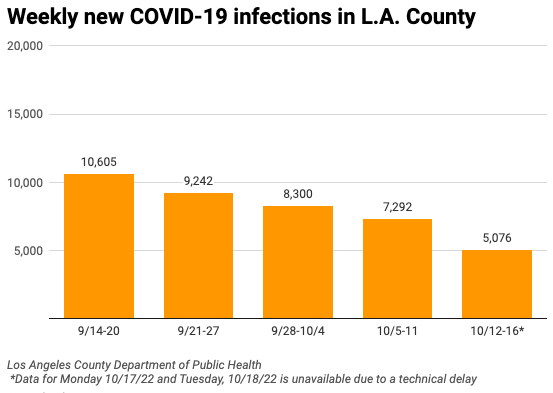
Last Thursday, the seven-day average for infections in the county dipped below 1,000, the first time that had occurred since mid-April. Currently, the average for COVID-19 cases is 953.
Three months ago, Los Angeles was averaging more than 6,000 cases per day.
3) A different kind of school test
Just as COVID-19 has declined in the general population, cases in area schools remain low. Although the Los Angeles Unified School District no longer conducts weekly PCR testing for its approximately half-million students and employees, it reports infection numbers.
From Oct. 12–18, there were 401 positive results across the district. It is possible some infectious but asymptomatic students were never tested.
There are currently 413 active cases among staff and students, according to the LAUSD. The district attributes nine of those infections to school-based transmission.
4) A positive change
Los Angeles County has hit another milestone: For the past five days, the daily test positivity rate has remained below 4%. The last time the rate stayed this low was the end of May.
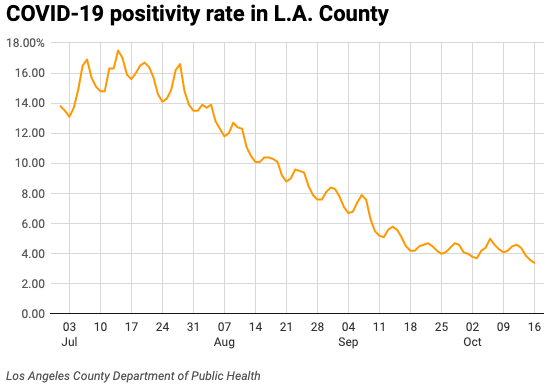
Currently, the county’s daily test positivity rate is 3.7%. Three months ago, it stood at 16.5%.
5) Coast to coast
The Dodgers’ disappointing early playoffs flameout means there won’t be an anticipated World Series match-up against the New York Yankees. But how do the regions measure up when it comes to COVID-19?
Los Angeles County has 10.04 million residents, while New York City has a population of 8.38 million. According to the New York Times, the city is averaging above 2,000 cases per day.
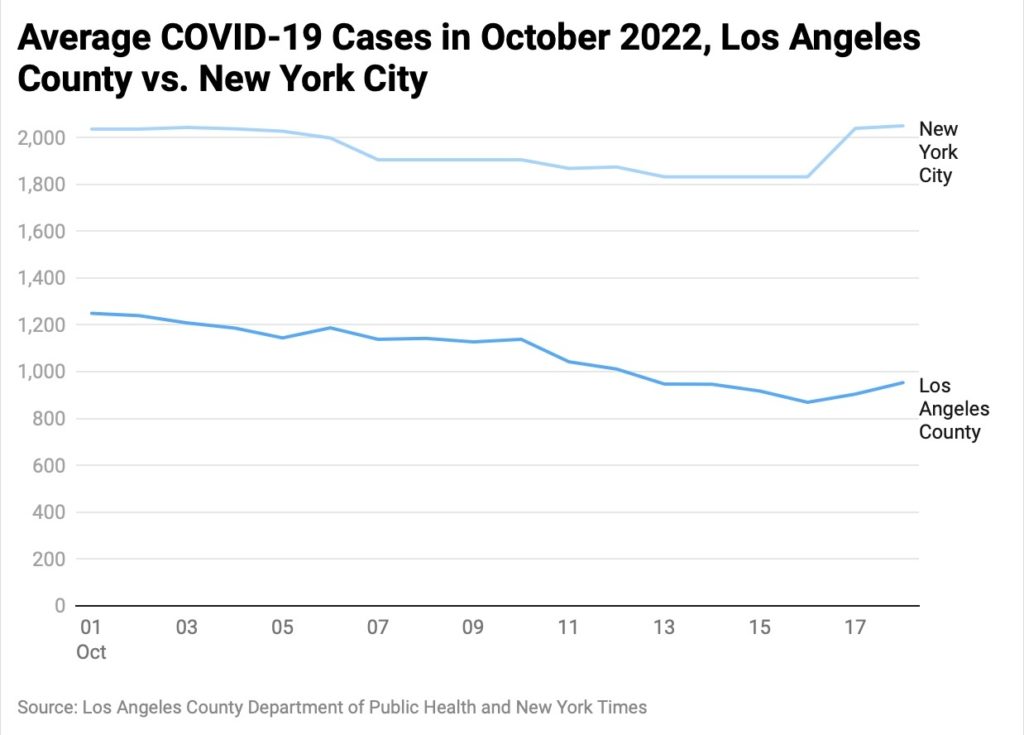
Meanwhile, Los Angeles County’s seven-day average has been sitting below 2,000 since the beginning of September.
Unlike baseball where runs rule, this is a situation where the lower number is better.
How we did it: We analyzed coronavirus data related to new cases, deaths, hospitalizations and vaccinations provided by the Los Angeles County Department of Public Health.
Interested in our data? Check out the Crosstown coronavirus interactive map or email askus@xtown.la.


