5 things to know about COVID-19 this week

For the past several months, the COVID-19 situation in Los Angeles seemed under control. Alarm bells are not yet ringing, but signs of a winter surge are on the horizon. Crosstown continues to provide a weekly update on county coronavirus data. Here is the latest.
1) Cases climb
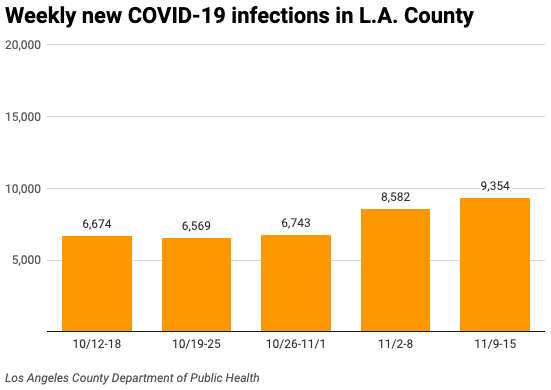
After a prolonged decline, COVID-19 cases have risen modestly for three consecutive weeks. On Nov. 1, the seven-day average for cases was 963. On Nov. 15, the average reached 1,336 cases. This is a 38.7% increase.

From Nov. 9–15, the Los Angeles County Department of Public Health reported 9,354 new infections, a 9% rise from one week before.
[Get COVID-19, crime and other stats about where you live with the Crosstown Neighborhood Newsletter]
2) Meeting the thresholds
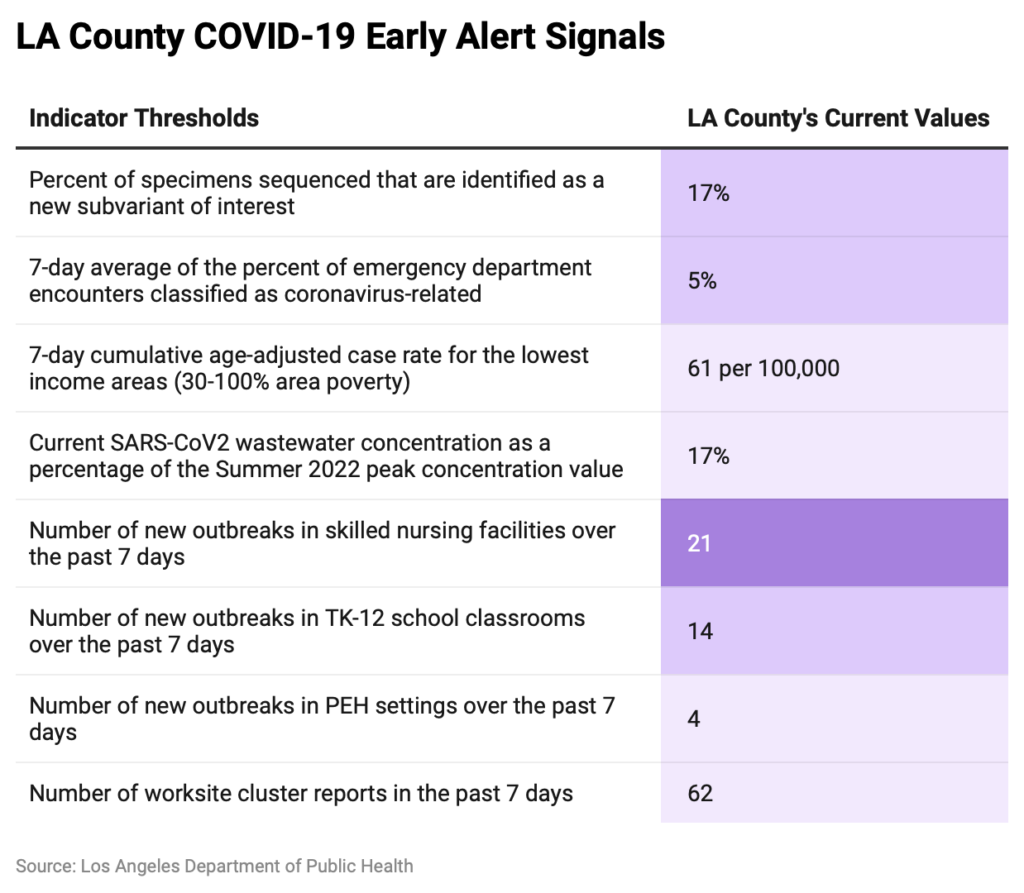
How do you know if it’s time to worry about worsening COVID-19 conditions? Many people get their cues from the Los Angeles County Department of Public Health.
The department has eight early alert signals that it tracks. On Nov. 1, only two of these metrics had reached the level of medium concern, and the rest were at low concern. Now, the county has one metric at high concern (the darkest purple in the below table) and three at medium concern (the next darkest color).

The county also tracks preparedness for a possible surge, and the greatest area of concern is the low number of people 65 and older who have received the updated bivalent booster. The threshold for “adequate protection” is 60%, but currently just 23% of residents in this age group have gotten the latest jab.
3) COVID-19 meets the flu
COVID-19 is not the only health concern facing Los Angeles County. An old “favorite” is back in the winter flu. The Department of Public Health recently warned of the dangers of rising flu and COVID cases.
The State Department of Public Health, meanwhile, reports that the latest positivity rate for flu in California is 14%, well above the usual level at this time in the past five years.
In Los Angeles County, the flu positivity rate is 25%, up from 13% the week prior.
4) More hospital beds are filled
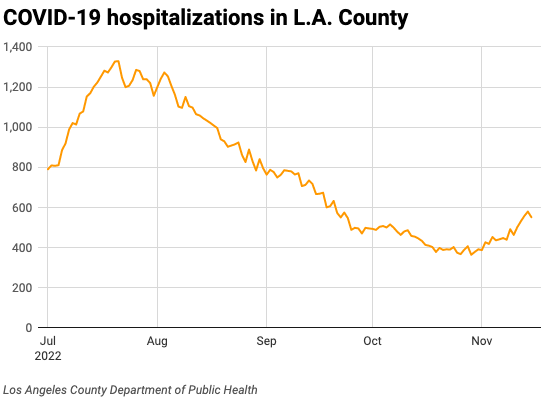
One reason for concern about the coming months is an increase in COVID-19 hospitalizations. On Oct. 29, there were 365 patients in area hospitals, the lowest figure since mid-May. Now, 552 people are being treated in medical institutions. That is a 51.2% increase.

Of course, figures are relative. At the worst point of the pandemic, there were more than 8,000 patients in area hospitals with COVID-19.
5) County vs. California
We know the coronavirus situation in Los Angeles County, but how does it fit with the rest of the state?
With 9.83 million residents, L.A. County accounts for about 25% of California’s population of 39.24 million residents. Over the past 90 days, the county has identified 3.3 million COVID-19 cases, making up 31% of the state’s total in that time period.
According to the state COVID-19 dashboard, California is seeing a seven-day average of 7.1 cases per 100,000 people. Meanwhile, Los Angeles County has 7.9 cases per 100,000 residents.
Everything depends on reporting and identifying cases. One reason for higher figures in L.A. could be better tracking here than in other parts of California. Or maybe more Angelenos really are getting sick.
How we did it: We analyzed coronavirus data related to new cases, deaths, hospitalizations and vaccinations provided by the Los Angeles County Department of Public Health, as well as data from the California Department of Public Health.
Interested in our data? Check out the Crosstown coronavirus interactive map or email askus@xtown.la.


