Crime in Unusual Places

News reports are full of crime stories. Most incidents happen in expected places, from a burglary in a liquor store to a shooting on a street corner.
But that’s not always the case.
The Los Angeles Police Department makes a record for every crime it records in the city. For each one it designates a “premise,” complete with a three number code. There are hundreds of locations on the roster.
Some of the more common include a sidewalk, an alley and a parking lot. Then there are the unlikely spots. There is a premise code for a crime at a nail salon and one for a bowling alley. The codes can identify specific locations, such as Rick Caruso’s shopping complex The Grove, or the Convention Center in Downtown.
[Get COVID-19, crime and other stats about where you live with the Crosstown Neighborhood Newsletter]
Examining the department’s publicly available data provides a glimpse of some of the unusual places where crime occurs. Here is a brief breakdown of three of them.
Dead zone
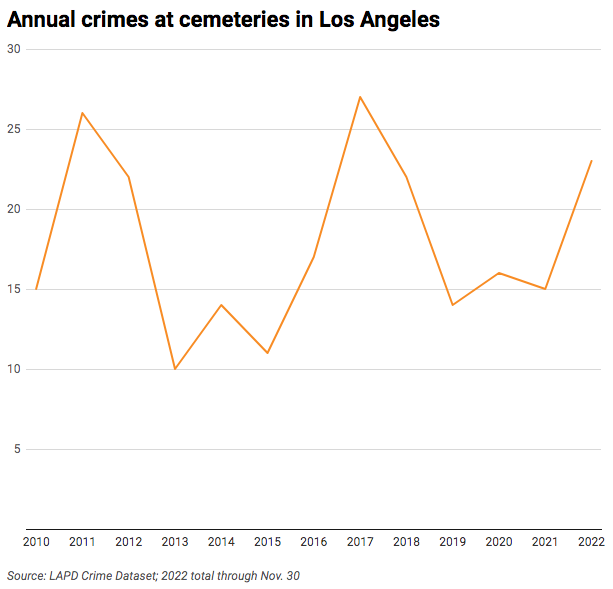
From Jan. 1–Nov. 30, the LAPD fielded 23 reports of crime in a cemetery in the city of Los Angeles. With a month to go in the calendar year, that is already the third-highest annual count since 2010. The peak was the 27 cemetery crimes in 2017.

Two incidents this year involved shots fired, and there was one case each with trespassing and vandalism. There was also one homicide: On April 19, according to police data, a 23-year-old Latino man was shot to death at Odd Fellows Cemetery on Whittier Boulevard in Boyle Heights. No one has been arrested.
Six crimes, or more than 20% of this year’s total, occurred in September. Seven incidents were recorded at the address of Forest Lawn cemetery in Griffith Park. That was more than any other location.
The most frequent crime at a Los Angeles cemetery this year was assault with a deadly weapon—five incidents were reported. There were three reports of vehicle break-ins, and three of grand theft where the value of the stolen merchandise was more than $950.
A double bogey is not a crime
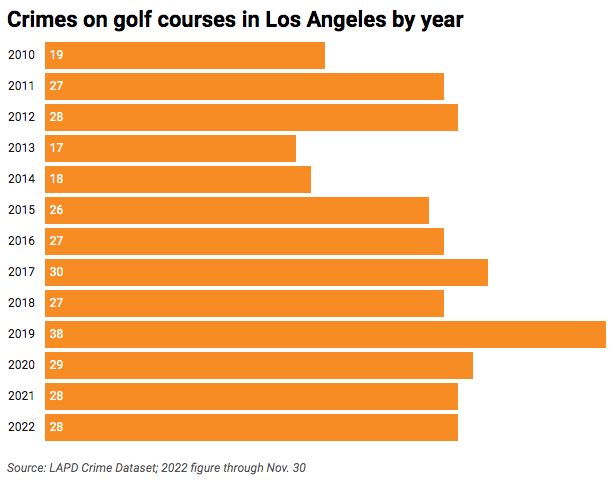
So far in 2022, there have been 28 crimes reported on golf courses in the city of Los Angeles. That is the same number as in all of last year, but below the peak of 38 incidents on courses in 2019.

The most frequent place for crime this year was the Westchester Golf Course, where five reports were taken. No other course in the city had more than two incidents.
There were nine reports of vehicle break-ins at a golf course, and a trio of criminal threat incidents with no weapon displayed.
A more serious encounter occurred on Oct. 16. According to police data, a 29-year-old man was on the links at the city-run Woodley Lakes Golf Course in the Sepulveda Basin at 6 p.m. when he was approached by a stranger. The assailant brandished some brass knuckles. An arrest was made.
Three strikes
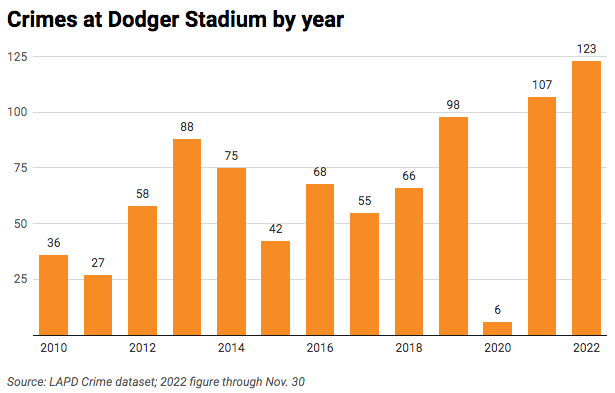
The Los Angeles Dodgers being drummed out of the playoffs in the first round after a season in which they recorded 111 victories seemed criminal. But there was actual illegal activity at the home of the Blue in 2022: Dodger Stadium was the site of 123 crimes, more than any year since at least 2010.

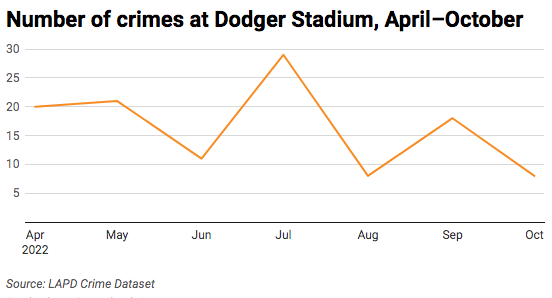
The season began in April and the height of the activity occurred in July, when there were 29 incidents. That was the second-highest monthly total since 2010, trailing only the 32 reports in August 2021.

What drove the numbers? Probably heightened security for the Major League Baseball All-Star Game. The event took place July 19, and there were eight crime reports for that evening; another two were recorded on July 18, when the Home Run Derby was held. Eight incidents over those two days involved battery—not the kind being done to a ball at the plate—and the other two were car break-ins.
The high-profile event wasn’t the only thing that led to crime. A series against hated rivals the San Francisco Giants on July 21-24 also led to a spike in activity, with eight incidents over four days. That included four instances of battery.
On the bright side, the Dodgers swept the series.
How we did it: We examined publicly available crime data from the Los Angeles Police Department from Jan. 1, 2010–Nov. 30, 2022. Learn more about our data here.
LAPD data only reflects crimes that are reported to the department, not how many crimes actually occurred. In making our calculations, we rely on the data the LAPD makes publicly available. LAPD may update past crime reports with new information, or recategorize past reports. Those revised reports do not always automatically become part of the public database.
Have questions about our data or want to know more? Write to us at askus@xtown.la.


