

5 things to know about COVID-19 this week


![]()
Each week, Crosstown reports on the latest COVID-19 figures in Los Angeles County. Here is what things look like.
1) Up, then down
In the first week of December, the average number of new coronavirus cases swelled to nearly 4,000 a day. Warnings from health leaders about another surge and a new mask mandate began to circulate.
Yet suddenly, things have taken a turn for the better.
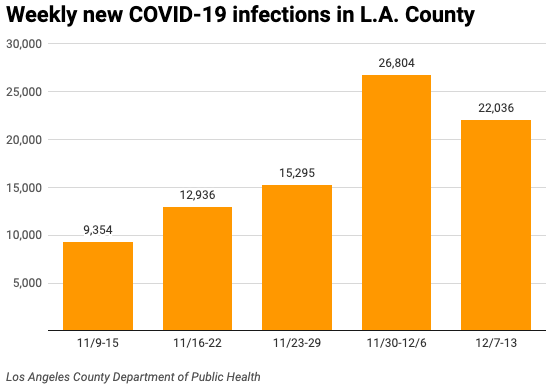
From Dec. 7–13, the Los Angeles County Department of Public Health reported 22,036 cases, a 17.8% decrease from the week before. The decline happened even though the department reported 5,051 new cases on Dec. 7. That was the second-highest daily figure since the beginning of August (Dec. 4 brought 5,106 cases).
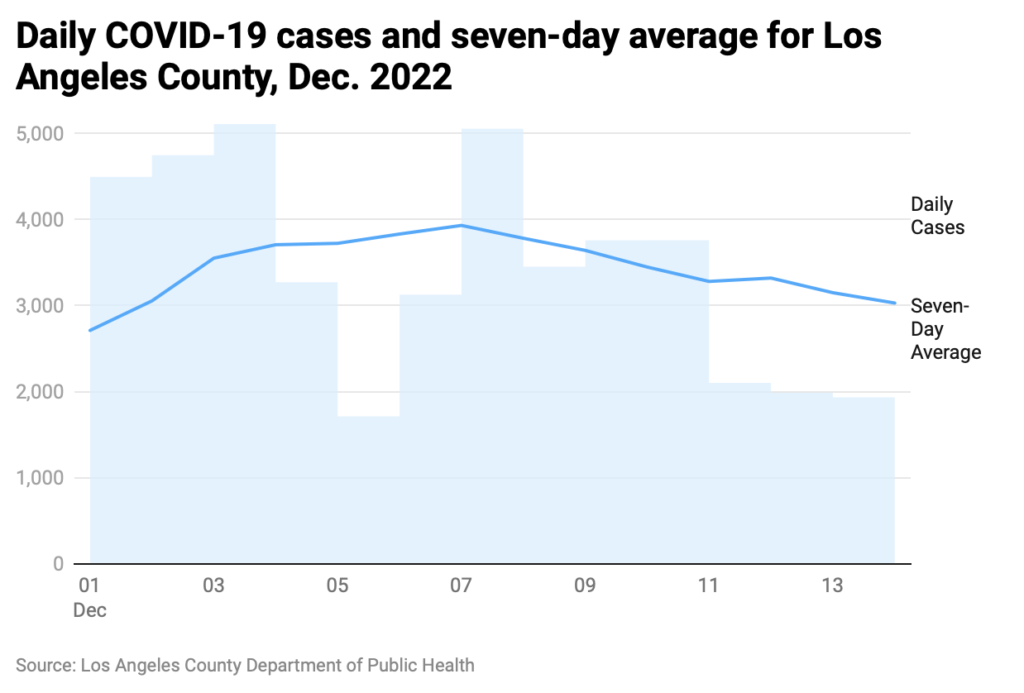
On Dec. 13, the seven-day average fell back down to 3,148. It is pleasant progress, though this marks a 143% increase from one month prior.
[Get COVID-19, crime and other stats about where you live with the Crosstown Neighborhood Newsletter]
2) Fatal figures
As cases fall, COVID-19-related deaths are rising again. This is no surprise, as fatalities are a lagging indicator, often increasing about a month after a spike in infections.

On Dec. 13, the seven-day average stood at 15 deaths per day, a level not seen since mid-August. Two weeks ago, the seven-day average was eight. There were 18 deaths recorded on Dec. 13, the highest tally since September.
3) Masks for good measure
On Dec. 9, the Department of Public Health released a statement urging residents to mask and get boosted as soon as possible. Although cases have dropped this week, the county remains in the Centers for Disease Control and Prevention’s High Community Level.
So what is the risk really? According to the Department of Public Health’s Dec. 9 COVID update, “If you attend a party with 200 people, the chance that at least one person at the party is infected with COVID, is between 80%–90%.”
In other words, take precautions before your holiday gatherings.
4) Coast to coast
Last Thursday, the CDC ranked several regions at high risk for COVID, including New York City and Los Angeles County. How do the areas measure up?
Los Angeles County has 10.04 million residents, and the region is averaging approximately 3,000 cases per day over the past week. Compare this with New York City, which has a population of 8.38 million, and according to the New York Times is currently averaging nearly 4,000 cases a day.
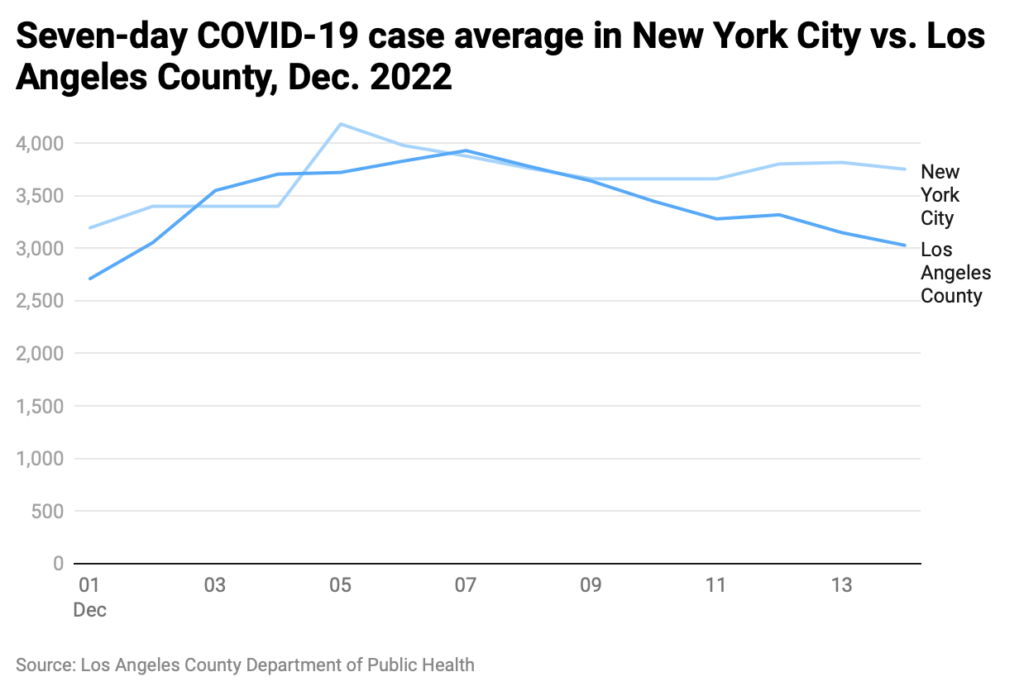
That indicates the situation is slightly more severe in New York City. Of course, precise figures are hard to know, as many cases identified in home tests and when people have only mild symptoms are never reported to health authorities, whether on the East or West coast.
5) Hospitalization stagnation
Hospitalizations continue to be an important metric for tracking COVID-19. After a quick uptick, levels in Los Angeles County have stabilized.
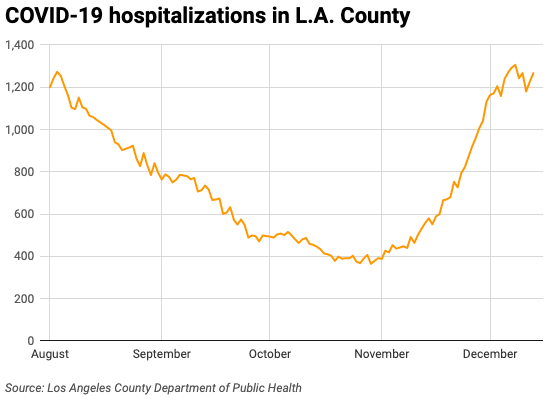
On Dec. 8, hospitalizations reached 1,306, a figure not seen since mid-July. On Tuesday, there were 1,267 patients in local medical institutions.
Everything is relative. One month ago about 600 people in the county were hospitalized. At the worst part of the pandemic, in January 2021, more than 8,000 patients were in local hospitals with COVID-19.
How we did it: We analyzed coronavirus data related to new cases, deaths, hospitalizations and vaccinations provided by the Los Angeles County Department of Public Health, as well as data from the California Department of Public Health.
Interested in our data? Check out the Crosstown coronavirus interactive map or email askus@xtown.la.


