

5 things to know about COVID-19 this week


It’s impossible to predict what will happen with the coronavirus, but Crosstown stays up to date on the latest COVID-19 developments in Los Angeles County. Here is what is happening.
1) The dip continues
After spiking in early December, COVID-19 cases have generally been on a decline. On Jan. 8, the seven-day average of new infections fell to 1,922. That was the lowest figure since Nov. 26.
From Jan. 4–10, the Los Angeles County Department of Public Health reported 14,408 new cases. That marks a 12.4% decrease from the week before.

On Tuesday, the seven-day average jumped back above 2,000, reaching 2,058. Once again, that is an undercount, as many testing locations have closed, and most people who test positive with home kits, but have only mild symptoms, never report the results.
[Get COVID-19, crime and other stats about where you live with the Crosstown Neighborhood Newsletter]
2) Fatal figures
The number of COVID-19 related deaths continues to climb, reflecting the increase in cases that took place in late November. On Tuesday, the seven-day average for fatalities hit 23. That is the highest count since March 24.

From Jan. 4–10, the Department of Public Health reported 160 total deaths from COVID-19. That marks a 17.6% increase from the week prior.
At the beginning of December, the average stood at eight.
3) More open hospital beds
As other figures rise and fall, the number of hospitalizations is bouncing in a narrow range just above 1,000 per day.
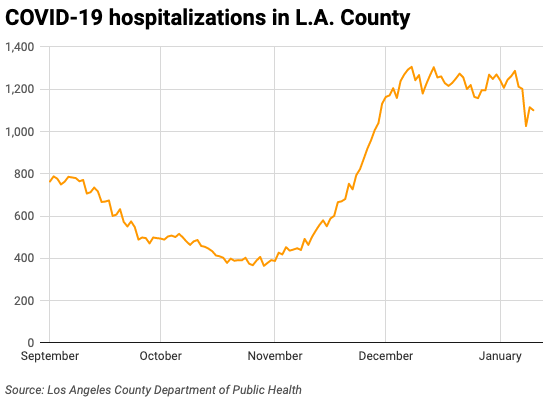
On Tuesday, there were 1,101 patients in area hospitals with COVID-19. This is a 7.9% decrease from two weeks ago.
Although health officials would welcome a strong downward trend, the stabilization in COVID-19 related hospitalizations is a good thing. Flu and RSV cases continue to put a significant strain on local hospitals (despite a slight decrease in cases and positivity rate for both). Children’s Hospital Los Angeles is still so busy that it cannot consistently accommodate transfers of patients from other hospitals, according to the Los Angeles Times.
4) School’s back in session
Before the winter break, the Los Angeles Unified School District sent kids home with COVID-19 tests, and asked students to break them out on Saturday or Sunday. It is hard to know precisely how many of the more than 400,000 K-12 students took the tests as requested, but district-wide infection numbers were low when classes resumed this week.
As of Wednesday, there were 1,085 positive cases among staff and students, according to a district dashboard. But that could change; the Department of Public Health on Jan. 6 suggested that everyone on LAUSD campuses wear a mask for at least 10 days to prevent a spike in infections.
That is a request, not a mandate, and it is unclear how many people are masking up.
5) Follow that variant
Talk of a new Omicron subvariant is buzzing across the United States. What does this mean for Los Angeles County?
Little is known about XBB.1.5 and how severe its symptoms will be, but in a Los Angeles Times report, Dr. Maria Van Kerkhove, the World Health Organization’s technical lead on COVID-19, called it, “the most transmissible subvariant that has been detected yet.”
The subvariant was first identified in New York, and it is currently the dominant subvariant in the Northeast.
The Centers for Disease Control and Prevention publishes a dashboard on variant spread in different parts of the United States. For Region 1, which includes states such as Connecticut and Massachusetts, XBB.1.5 makes up 71.6% of the cases.
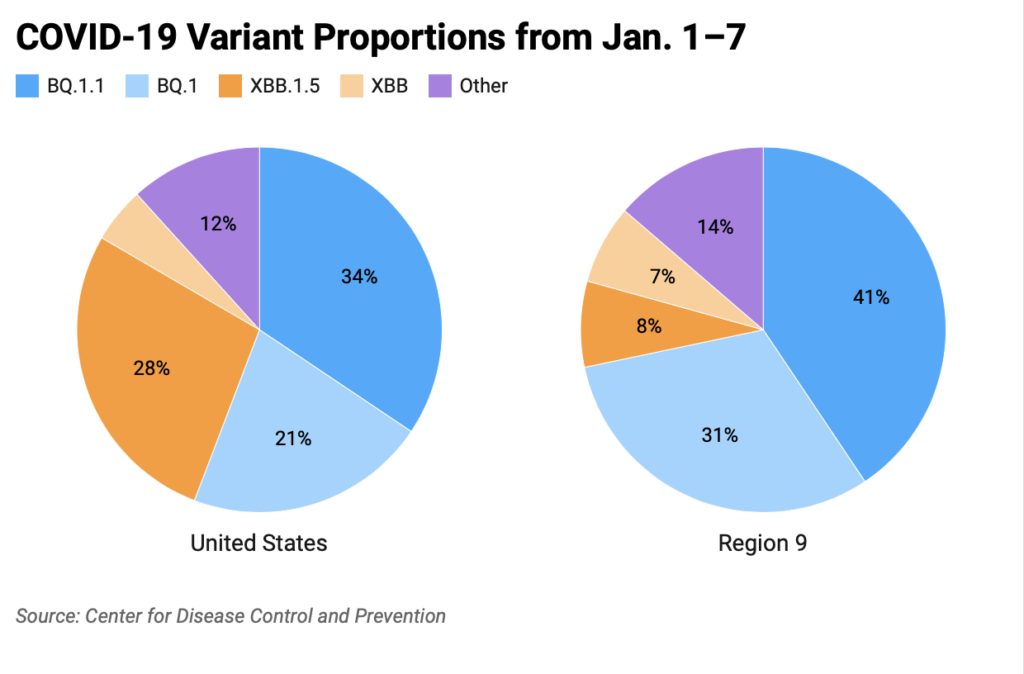
XBB.1.5 is spreading quickly in the rest of the country, and is now the second most common subvariant after BQ.1.1, according to the CDC. However, in Region 9, which includes California, Arizona, Hawaii and other Western U.S. states and territories, the pace of infection is slower.
For these states, BQ.1 and BQ.1.1 make up more than 70% of cases, while XBB.1.5 only accounts for 7.6% of reported infections.
How we did it: We analyzed coronavirus data related to new cases, deaths, hospitalizations and vaccinations provided by the Los Angeles County Department of Public Health, as well as data from the California Department of Public Health and the Centers for Disease Control and Prevention.
Interested in our data? Check out the Crosstown coronavirus interactive map or email askus@xtown.la.


