

The Crosstown Crime Book: February


With the Crime Book, Crosstown examines monthly statistics and trends in criminal activity, using publicly available Los Angeles Police Department data. Here is how things looked in February.
A year ago at this time, a flurry of news stories about rising crime in the city had many Angelenos alarmed. Homicides had reached a level not seen in nearly 15 years, and a series of violent follow-home robberies prompted the LAPD to form a new task force.
The situation today is markedly different, with February crime figures generally lower than those of early 2022. A downward trend began late last year, though gains are relative, as some serious crimes are occurring more frequently than before the pandemic.
[Get COVID-19, crime and other stats about where you live with the Crosstown Neighborhood Newsletter]
“We continue to see an improvement in our violent crime numbers, specifically in our shooting violence,” LAPD Chief Michel Moore told the Los Angeles Police Commission at its Feb. 28 meeting. He added that there had been “decreases in violent crimes in each of our categories.”
According to LAPD Compstat data, from Jan. 1–March 4 there were 4,609 reports of violent crime in the city, which is 11.7% lower than during the same period last year. It is a more modest 4.6% drop from the 4,831 incidents in that timeframe in 2021.
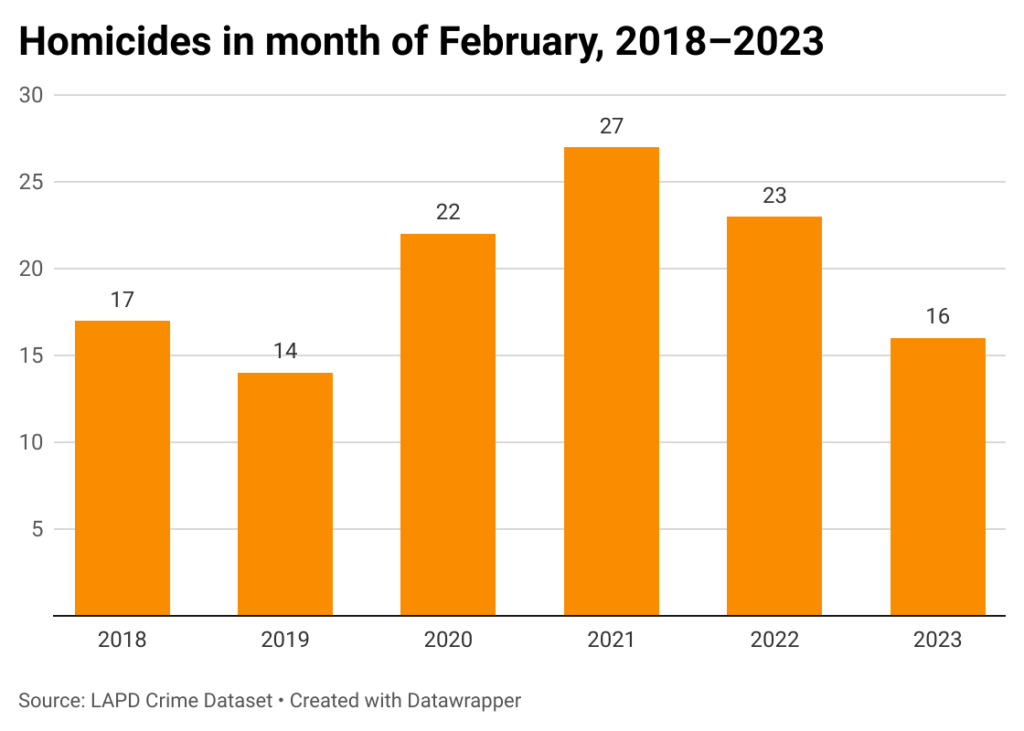
The most significant decline is in murders. There were 16 reported in February; in the same month in each of the last three years, the count was above 20.
In recent years, approximately three-quarters of the homicides in Los Angeles involved a firearm, and in some instances the murder weapon was an untraceable “ghost gun.” In February there were 89 reports of victims shot, the fifth consecutive month the figure stayed in a relatively low and narrow range.
For more than a year before that, the monthly total was often more than 115 people struck by gunfire.
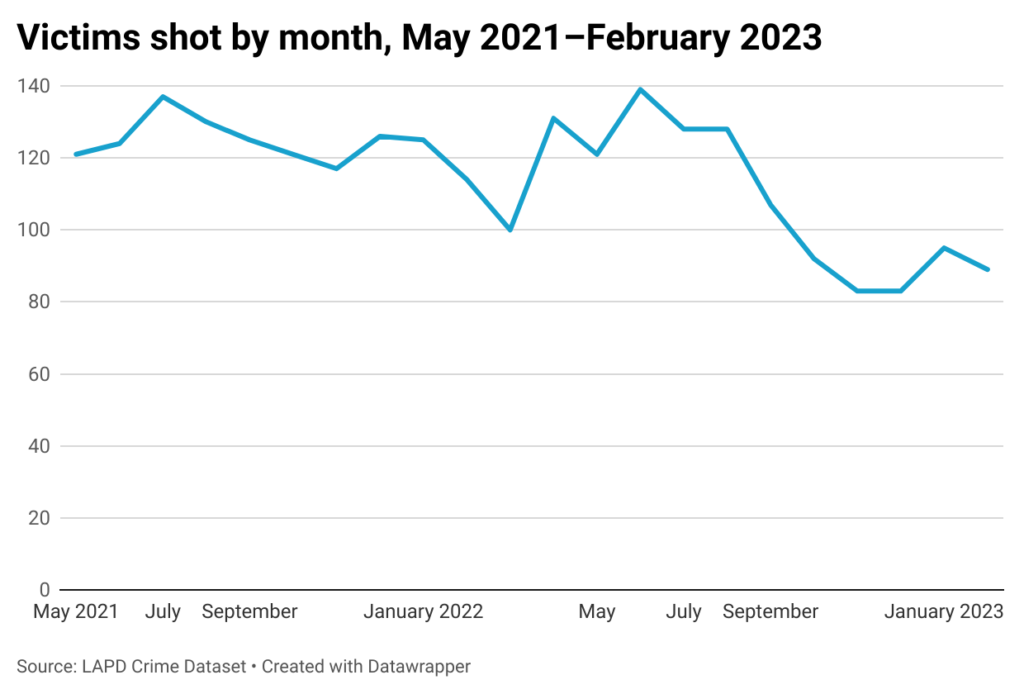
Despite the recent statistical improvements, gun violence in Los Angeles is higher than in the years before COVID-19. The February 2023 count of 89 victims shot far exceeds the 51 people hit by gunfire in February 2018, and the 52 in the same month in 2019.
Similarly, the 209 reports of shots fired last month is below the total in February 2022 and 2021, but is above pre-pandemic levels.
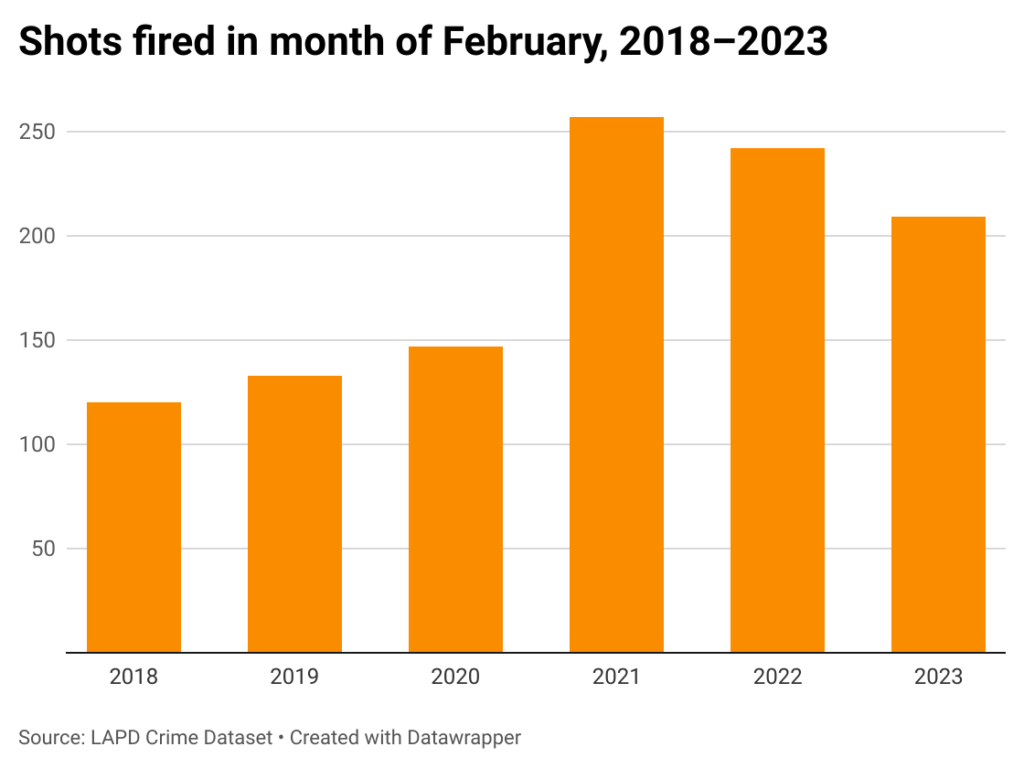
According to police data, the neighborhood with the greatest number of shots fired reports last month was Downtown, with 10. There were nine calls each in Boyle Heights, Historic South-Central and Vermont Slauson.
Another category where figures are declining is robberies involving guns. The 162 incidents in February is a 35.2% drop from 250 in the same month last year.
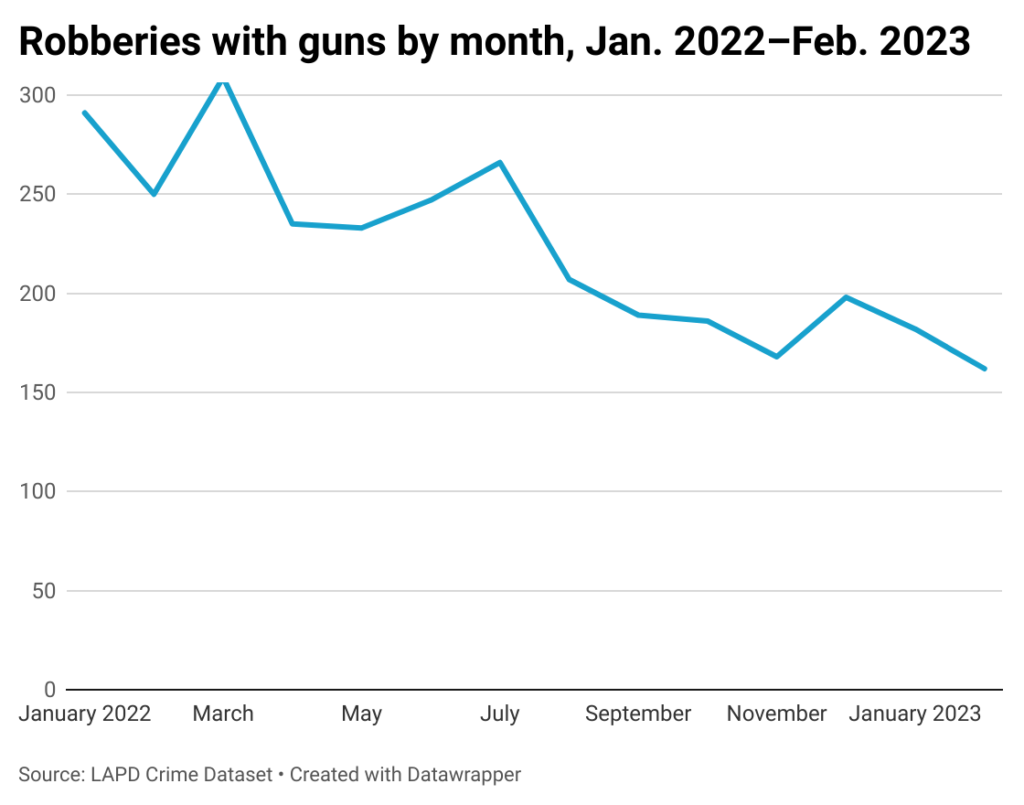
That comes as the follow-home robbery task force reported gains. The LAPD late last year announced that through Dec. 1, 2022, it had identified 328 follow-home robberies and made 122 arrests. That included five for murder, and nine for attempted murder.
Pilfered property
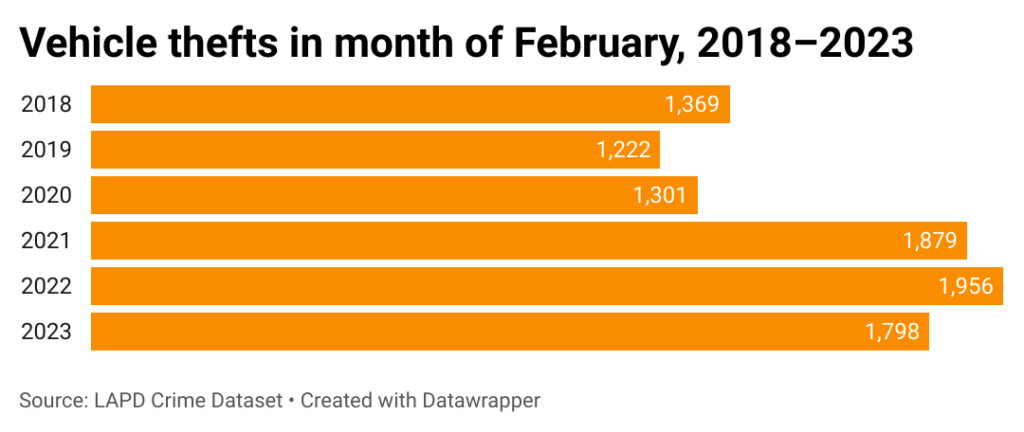
One of the most troubling pandemic-era trends in Los Angeles was the surge in vehicle thefts. There were 25,400 cars stolen in 2022, according to police data. That was a 61.5% increase over the approximately 15,700 such crimes in 2019.
Vehicle thefts have dipped recently, with fewer than 2,000 reports in each of the last four months. There were 1,798 cars stolen in February.
Yet the pace of incidents remains well above totals throughout the 2010s. In February 2023 an average of 64 vehicles were stolen each day in the city. In February 2019 there were 1,222 car thefts, for an average of 44.
There were 1,043 burglaries in February, similar to the count in the same month in each of the last five years.
Downtown was the site of 54 burglaries last month, more than any other neighborhood. The communities with the next highest counts were Northridge (30 reports) and Hollywood (28).
Through March 4, according to LAPD Compstat data, there had been 16,976 property crimes in the city. That represents a 3% drop from the same period in 2022. However, it is a 10.2% increase over the equivalent period in 2021.
How we did it: We examined publicly available crime data from the Los Angeles Police Department from Feb. 1, 2018–Feb. 28, 2023. We also examined LAPD Compstat data. Learn more about our data here.
LAPD data only reflects crimes that are reported to the department, not how many crimes actually occurred. In making our calculations, we rely on the data the LAPD makes publicly available. LAPD may update past crime reports with new information, or recategorize past reports. Those revised reports do not always automatically become part of the public database.
Have questions about our data or want to know more? Write to us at askus@xtown.la.


