

Murders, car thefts and other crimes: A tale of five Aprils


If you want a case study in how COVID-19 impacted public safety, and at the same time aim to understand the current crime picture in Los Angeles, then the month of April is key.
Although Mayor Eric Garcetti’s Safer at Home order went into effect in March 2020, April marked the first full month that the city was essentially shut down. Movie theaters, gyms and many other businesses were closed. Most schools and offices went remote.
[Get crime, housing and other stats about where you live with the Crosstown Neighborhood Newsletter]
With fewer people on the streets, there were dramatic shifts in crime. Some categories saw a steep drop. In others, there were surprising increases.
Crime data, which the Los Angeles Police Department makes publicly available, should always be examined in context with past periods, and the month of April provides an opportunity to consider not only year-over-over changes, but also how the current moment compares with the early part of the pandemic, and the time before we even heard of the coronavirus. In a twist on the monthly Crime Book, Crosstown looks at data in five categories each April from 2019 to 2023.
Homicides and gun violence
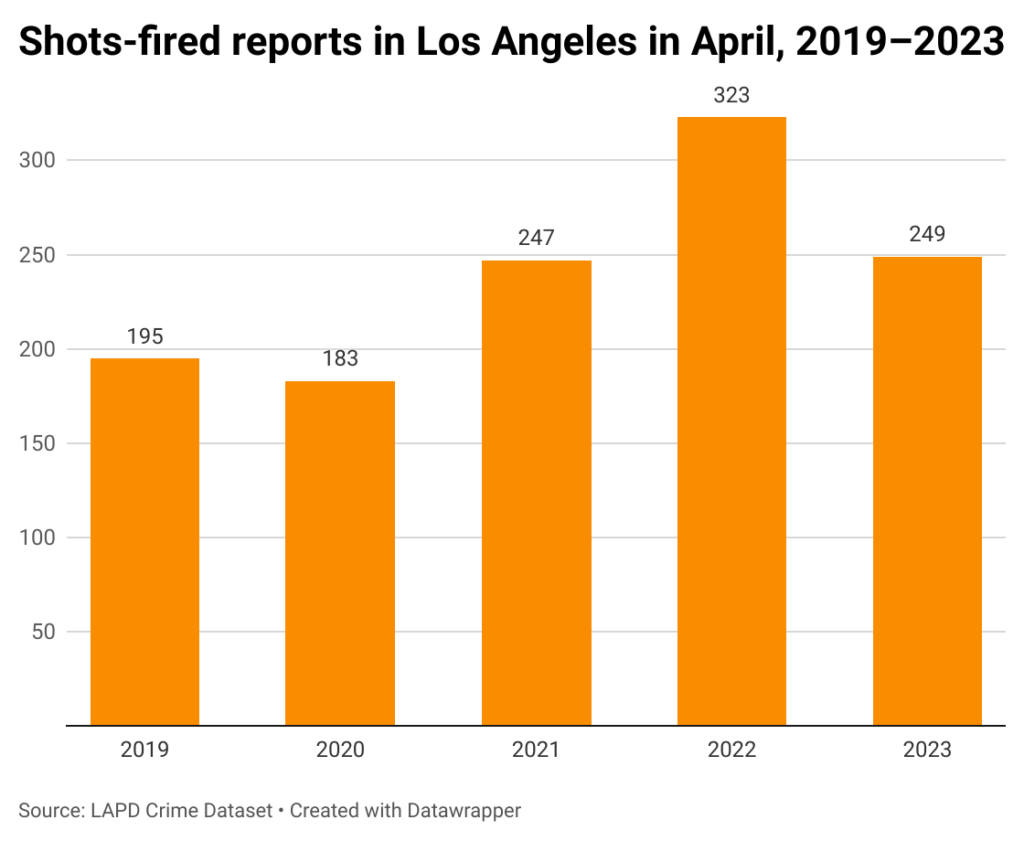
People might have expected that limited personal interaction would lead to fewer violent encounters. However, April 2020 brought more gunshots than were recorded in March. A trend was underway: Gunshot reports in the city would rise in each of the next six months.
In the following two years there would be ups and downs, but April 2022 was particularly violent: There were 323 shots-fired reports, the third highest monthly total since 2010.
Last month there were 249 gunshot reports in the city. That is a 23% drop from April 2022, and is equivalent with the same month in 2021.
However, the count remains well above the 195 gunshot reports in April in the pre-COVID year of 2019. In the past year LAPD Chief Michel Moore has repeatedly cited a worrying rise in the use of untraceable “ghost guns.”
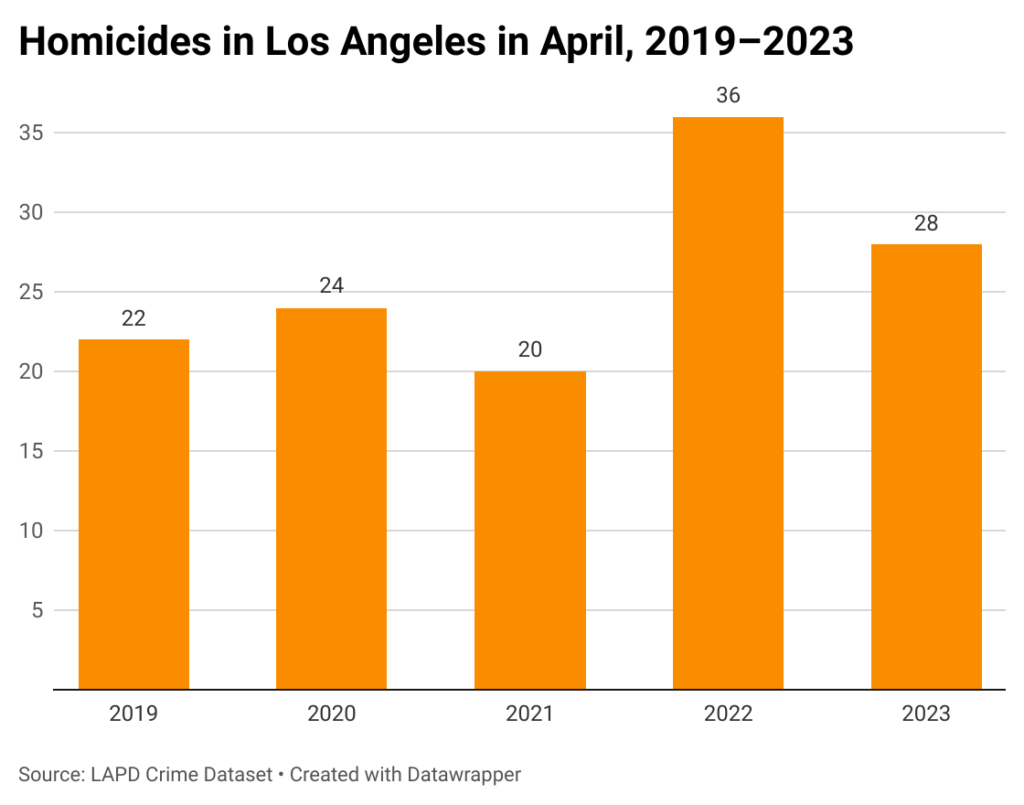
The trend is similar with murders. They rose in April 2020 over the previous month, and remained elevated for more than two years. The homicide level in 2021 in the city was the highest in 14 years. Los Angeles was not an anomaly: During the pandemic many other big cities across the country experienced a sharp increase in murders and gun violence.
There were 28 killings last month in Los Angeles. As with gunshots, this is down from April 2022, when there were 36 murders.
Although overall homicides this year are ticking down, the April count exceeds the 22 murders in the same month in 2019.
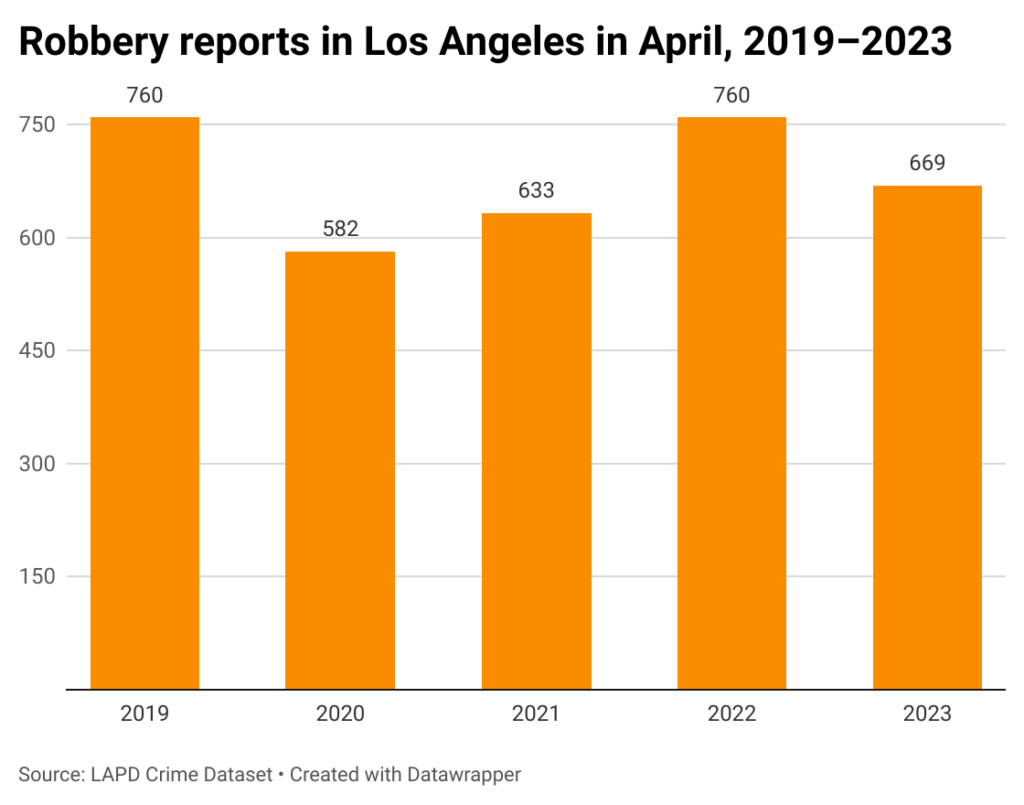
The effects of the shutdown were also felt in another violent crime category: robbery. April 2020 had the lowest monthly count in six years, at 582 reports. That represented a 23.4% decline from the 760 incidents the previous April.
Robbery totals have generally remained below where they were in the middle of the last decade. Last month there were 669 reports.
Stolen property
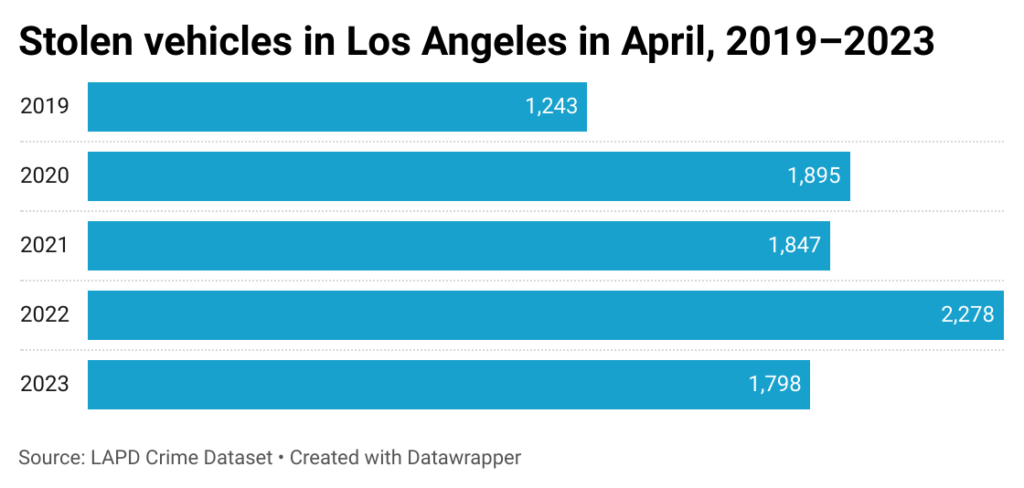
The crime category that COVID-19 had the greatest immediate impact on was stolen vehicles. As cars remained parked on the street for days or weeks on end, thieves pounced.
In April 2020 there were 1,895 reports of car theft in Los Angeles. That was almost 400 more than the previous month, and marked a 52% increase from the count in April 2019. Numbers have remained high ever since.
If there is a silver lining, it is that the 1,798 stolen vehicles last month is a 21% decline from April 2022. Still, it exceeds the total in every month in the entire 2010s.
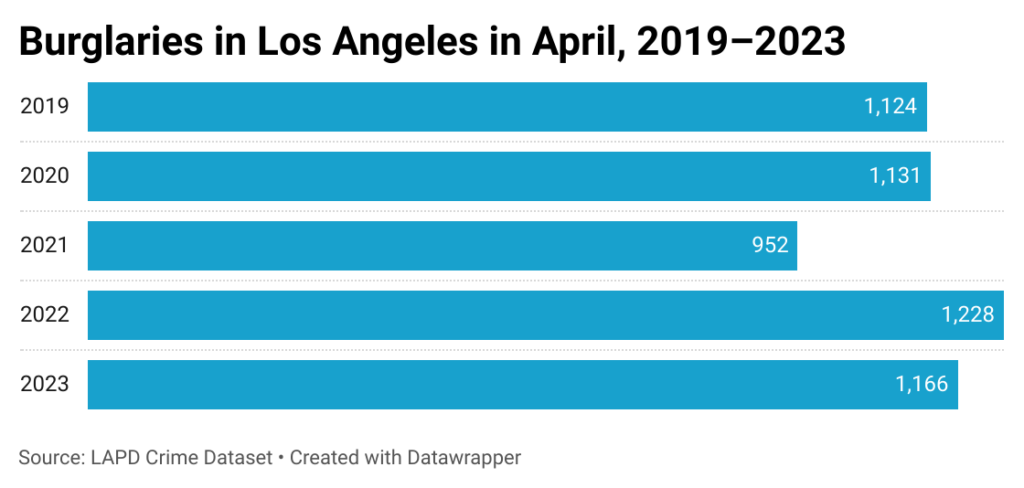
One category with little variation in the past five Aprils is burglary. While there are occasional changes in location—break-ins at homes, businesses and stores can fluctuate—numbers have been consistent.
Last month there were 1,166 burglary reports in the city. That is in line with figures in both 2019 and 2020.
How we did it: We examined publicly available crime data from the Los Angeles Police Department from April 1, 2019–April 30, 2023. Learn more about our data here.
LAPD data only reflects crimes that are reported to the department, not how many crimes actually occurred. In making our calculations, we rely on the data the LAPD makes publicly available. LAPD may update past crime reports with new information, or recategorize past reports. Those revised reports do not always automatically become part of the public database.
Have questions about our data or want to know more? Write to us at askus@xtown.la.


