

Los Angeles sees fewer robberies, but more incidents involve guns


In the past several months, robberies of street vendors and department stores in Los Angeles sparked headlines. These and other recent trends—including a series of “follow-home” robberies last year—have figured into discussions about whether the city is becoming more dangerous even as overall crime drops.
While offering a definitive picture of crime is difficult due to ups and downs in various categories, when it comes to robberies—in which something of value is taken from a victim by threat or force—there is good news: According to Los Angeles Police Department Compstat data, incidents in the first nine months of 2023 are down 10% from the same period last year.
[Get crime, housing and other stats about where you live with the Crosstown Neighborhood Newsletter]
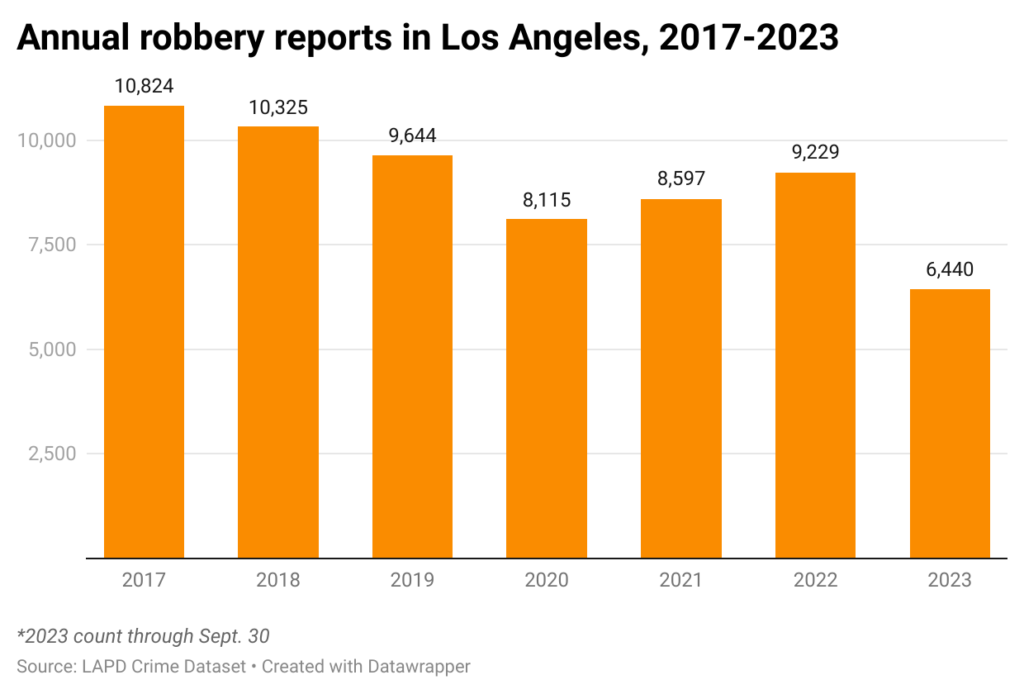
According to publicly available Los Angeles Police Department data, from Jan. 1–Sept. 30 there were 6,440 robberies reported in the city. Los Angeles is on pace to record approximately 8,600 robberies this year.
In 2022, there were 9,229 robbery reports in the city, according to police data. The recent peak was the 10,824 incidents in 2017.
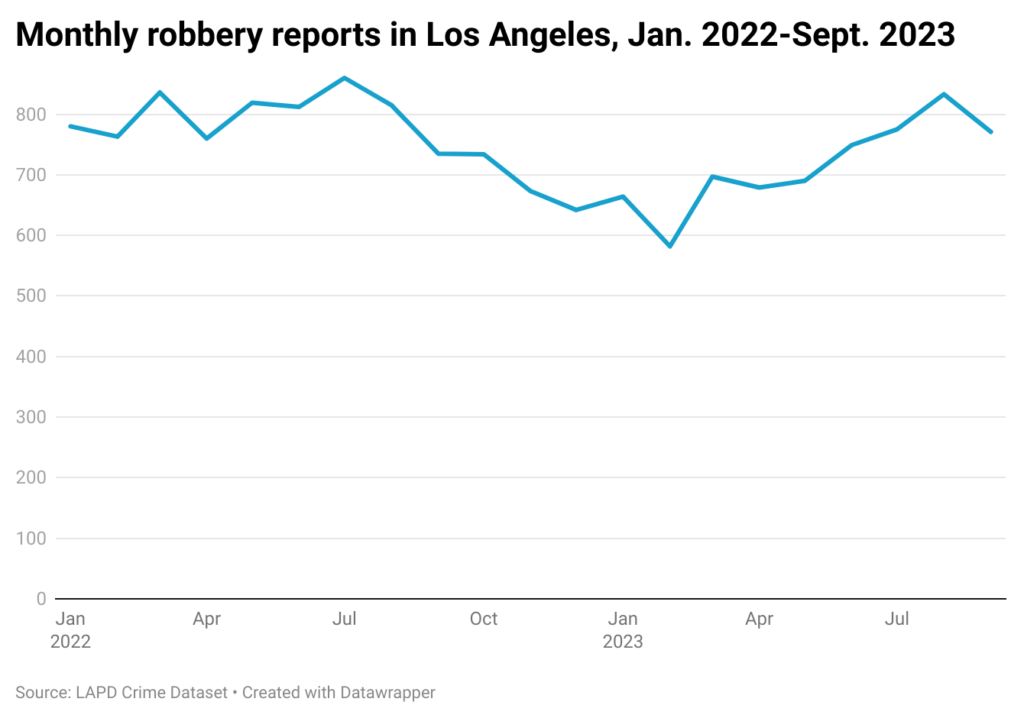
After recording 860 robberies in July 2022, incidents fell steadily, to a low of 582 in February. However, starting this May there were four consecutive monthly increases.
More frequent use of guns
The decline in robberies this year tells only part of the story, and by some indications things are more dangerous than they were before the pandemic. At meetings of the Los Angeles Police Commission, LAPD Chief Michel Moore has frequently decried the prevalence of handguns.
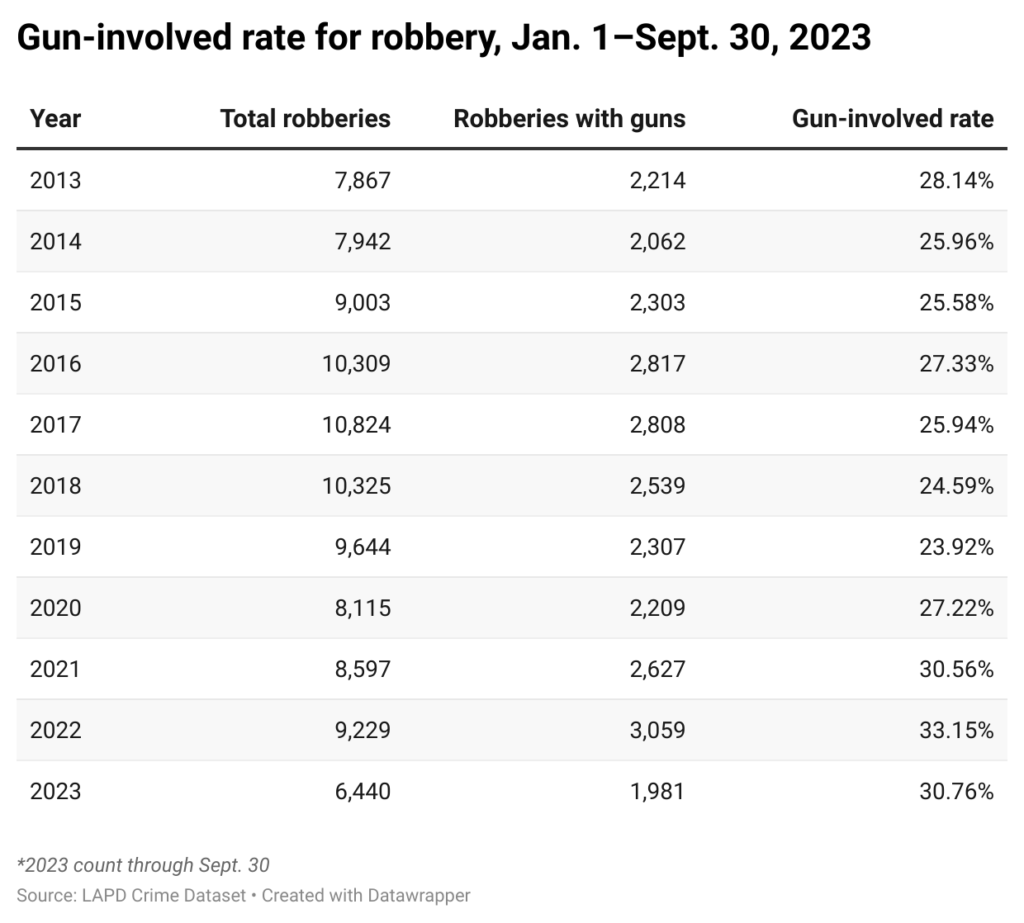
At the panel’s July 25 meeting, Moore stated, “While we have a 14% reduction of robberies as a city, we have a more than 16% increase in robberies involving a firearm from 2019.”
The trend is also reflected in the proportion of incidents in which a firearm is employed. According to LAPD data, in the entirety of 2019, a gun was used in 23.9% of robberies. The rate surpassed 33% last year, and in the first nine months of 2023 is at 30.8%.
Crimes on the street
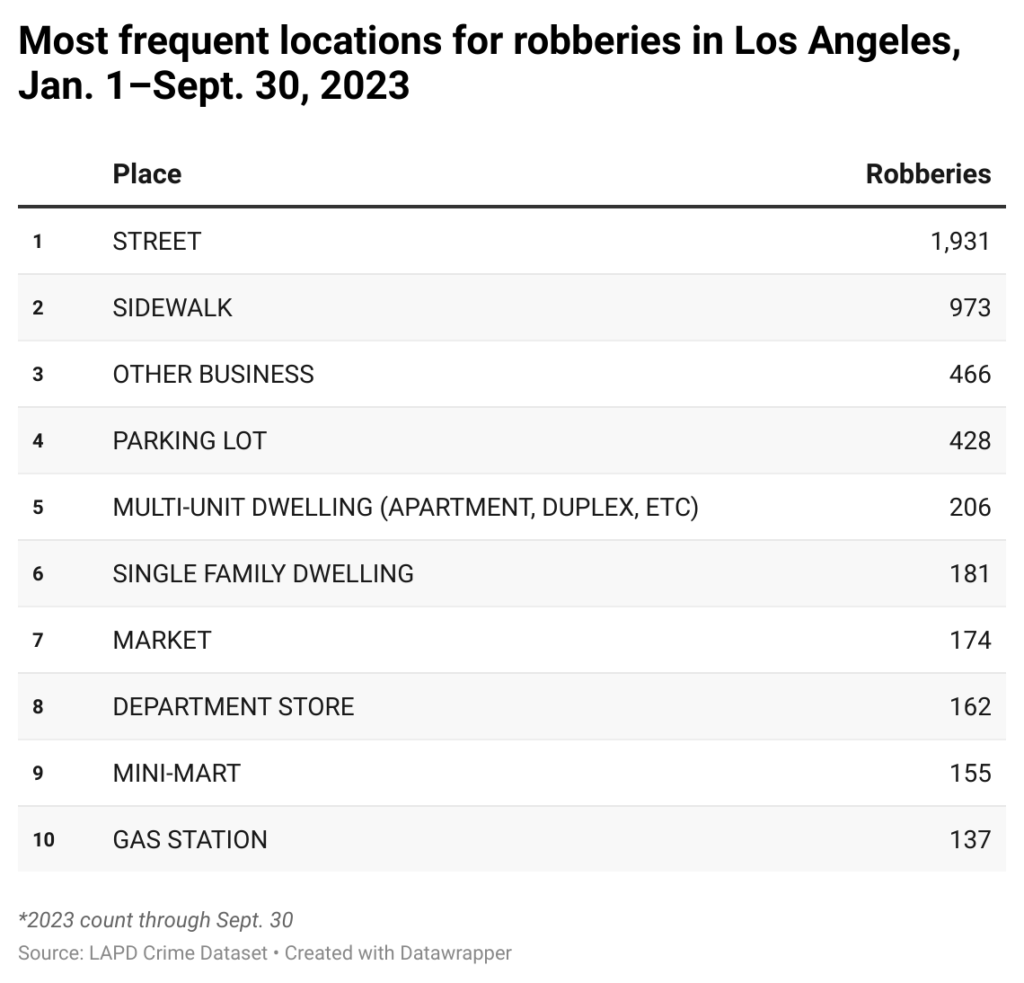
The preponderance of robberies happen in public spaces. According to police data, more than 45% of the robberies in the city this year took place on the street or sidewalk. There were 415 reports at residences, which accounts for 6% of the total.
In 74% of robberies, the perpetrator was a stranger. According to police data, 77% of robberies in the first nine months of the year are classified as “investigation continuing,” meaning no one has been arrested or the crime has otherwise not been closed.
One exception to that was a violent robbery that occurred in Chinatown on Sept. 14. On Wednesday, police announced that Courtland Thornton, 31, had been arrested for robbing a business on the 800 block of North Broadway. Surveillance video showed him assaulting a female employee who tried to thwart the robbery. She was hospitalized for her injuries.
As is the case with many crime categories, dense Downtown sees more robberies than any other community in the city. There were 641 robberies reported in the neighborhood in the first nine months of this year. The next highest counts were in Westlake (328 reports) and Hollywood (286).
In many instances, some of the most vulnerable Angelenos are involved in crimes. According to police data, 384 unhoused people were robbery victims in the first nine months of this year. During the same period, there were 720 reports where the suspect was experiencing homelessness.
How we did it: We examined publicly available crime data from the Los Angeles Police Department from January 1, 2011–Sept. 30, 2023. Learn more about our data here.
LAPD data only reflects crimes that are reported to the department, not how many crimes actually occurred. In making our calculations, we rely on the data the LAPD makes publicly available. LAPD may update past crime reports with new information, or recategorize past reports. Those revised reports do not always automatically become part of the public database.
Have questions about our data or want to know more? Write to us at askus@xtown.la.


