

Los Angeles on pace to surpass 300 traffic collision deaths for second consecutive year


The Oct. 17 deaths of four Pepperdine University seniors by a speeding driver has sparked outrage and calls to improve safety on Pacific Coast Highway. But Malibu, where the students were struck and killed, is not the only place wrestling with such dangers. Traffic fatalities are also rising in the city of Los Angeles.
“Fatal traffic collisions this year have taken 250 lives,” LAPD Chief Michel Moore stated during a recent meeting of the Los Angeles Police Commission. The deaths, from the period of Jan. 1–Oct. 14, was nine more than in the same timeframe in 2022.
Then Moore added, “But most troubling is when we look back to 2019, that number was 188. That’s a 33% increase.”
[Get crime, housing and other stats about where you live with the Crosstown Neighborhood Newsletter]
Los Angeles, like many cities, saw traffic deaths rise after the onset of the pandemic. This was attributed to factors such as emptier roads, which in some instances prompted drivers to speed, increasing the likelihood of a collision, as well as the severity when one occurred.
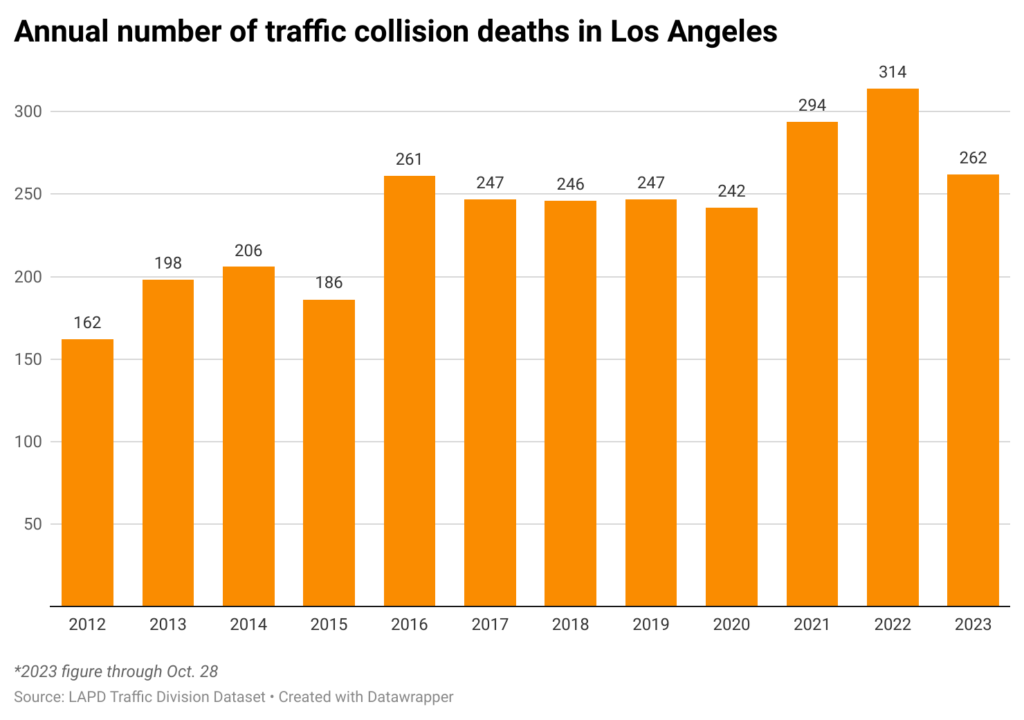
Although many people have resumed pre-COVID driving habits, the situation has only worsened. An examination of publicly available LAPD Traffic Division data indicates that 2023 could become the deadliest year on city streets in more than a decade. That includes surpassing 2022, when 314 people died in traffic collisions in the city.
Through Oct. 28, there had been 262 vehicle-related deaths in Los Angeles, according to LAPD data. That already exceeds the count in every full year from 2010-2020.
The tragedy has been unceasing. It includes an incident in April, when a mother was killed and her 6-year-old daughter was critically injured when they were struck by a pickup truck in the morning while walking to school in Hancock Park. Authorities said the collision occurred after the driver suffered a medical emergency.
There were multiple traffic deaths in the last week alone. They included Darrell Cunningham Shamily, an off-duty LAPD officer. The four-year veteran of the department was killed early Saturday after a suspected drunk driver traveling at more than 100 mph slammed into Shamily’s vehicle in Northridge.
Many serious injuries
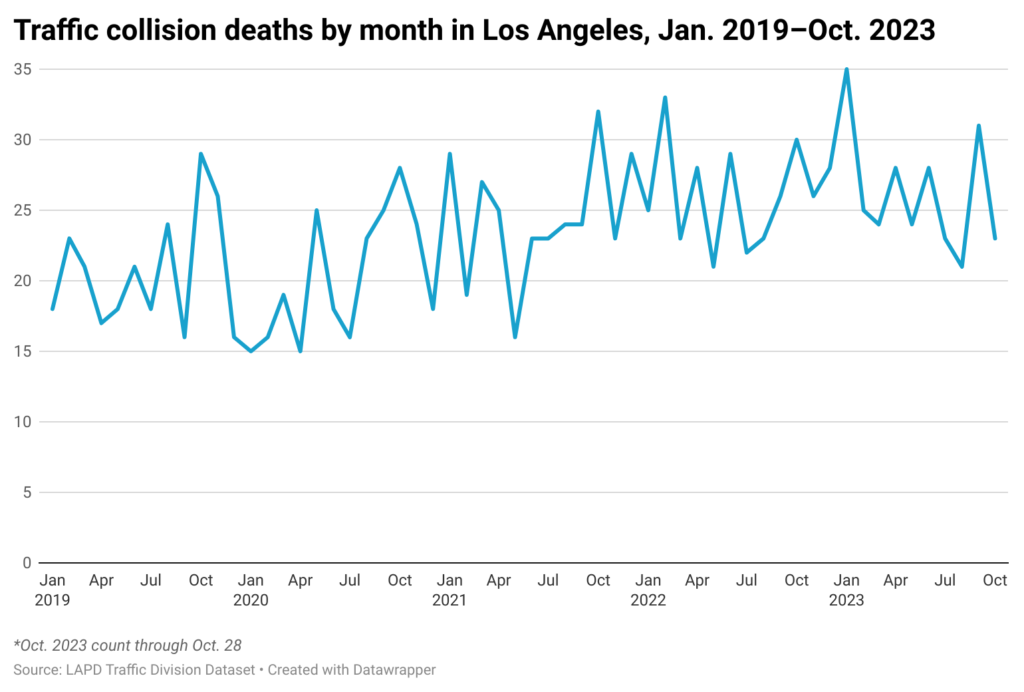
The highest number of deaths in a single month this year was the 35 in January. The next highest count was the 31 fatalities in September.
The LAPD also tracks serious injuries suffered in collisions. Through Oct. 28, the department had recorded 1,237 of them, slightly higher than at the same time each of the last two years.
Deaths and serious injuries have increased despite high-level efforts to make the streets safer. In 2015, Mayor Eric Garcetti launched Vision Zero. The goal was to reduce traffic deaths to zero by 2025, through a series of improvements including bike infrastructure and upgraded signals.
The effort extends to those not in cars. In August the LAPD launched a campaign encouraging pedestrians to be aware as they cross the street, and to pay attention to vehicles rather than their cell phones.
A new tool in the safety arsenal arrived last month, when Gov. Gavin Newsom signed a bill allowing the use of speed cameras in Los Angeles and five other cities. The cameras will issue automatic tickets to those who exceed the speed limit by 11 mph or more near schools and high-injury intersections. The hope is that citations will spur drivers to slow down, and thus reduce collisions.
Dangers for pedestrians and cyclists
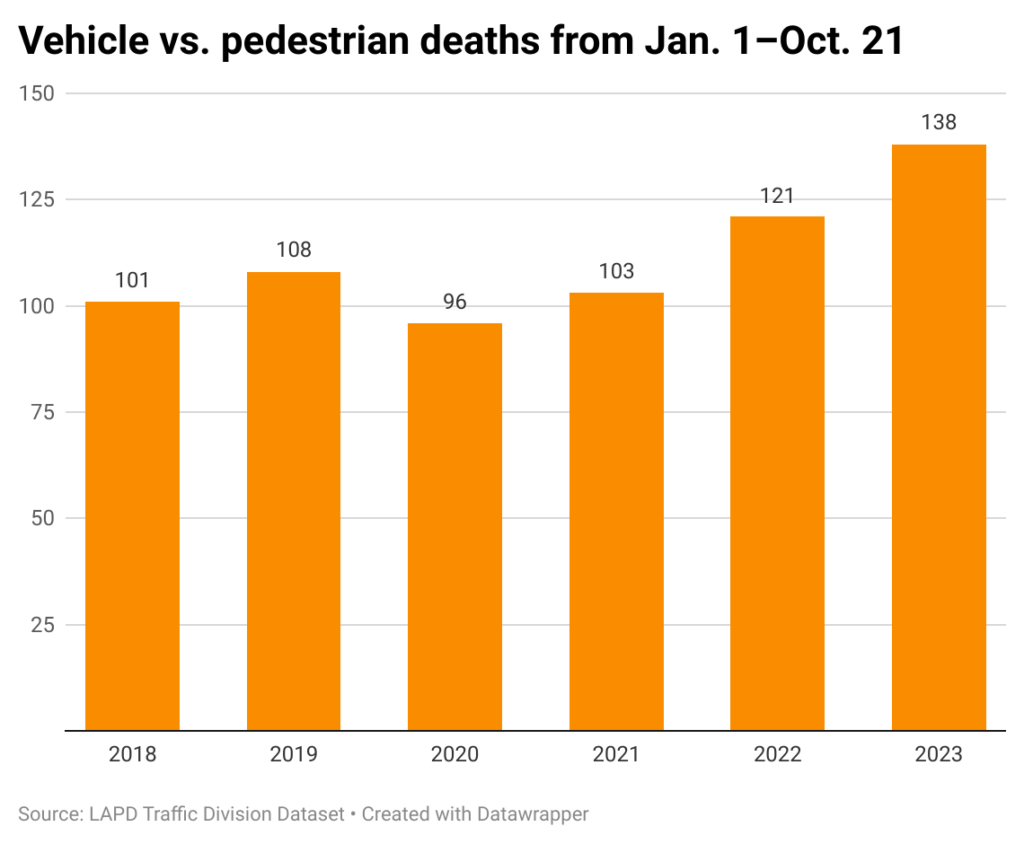
The LAPD measures traffic collisions in a variety of ways. Department Compstat data shows that in the period from Jan. 1–Oct. 21, there were 138 deaths resulting from a pedestrian struck by a vehicle. That is up 14% from the same period last year, and is a 34% increase—meaning 35 additional fatalities—from that timeframe in 2021.
At the Police Commission meeting Moore cited additional factors, including distracted drivers and DUI-related collisions.
“Year to date, 22 of our fatal traffic collisions have involved individuals that we believe are driving under the influence,” he stated. “That number in 2019 was 15, a 47% increase.”
There are also dangers for those on two wheels. According to Compstat data, 19 bicyclists have been killed on city streets this year. That is similar to the 18 at the same point last year, though at this time in 2021 the count was just 11.
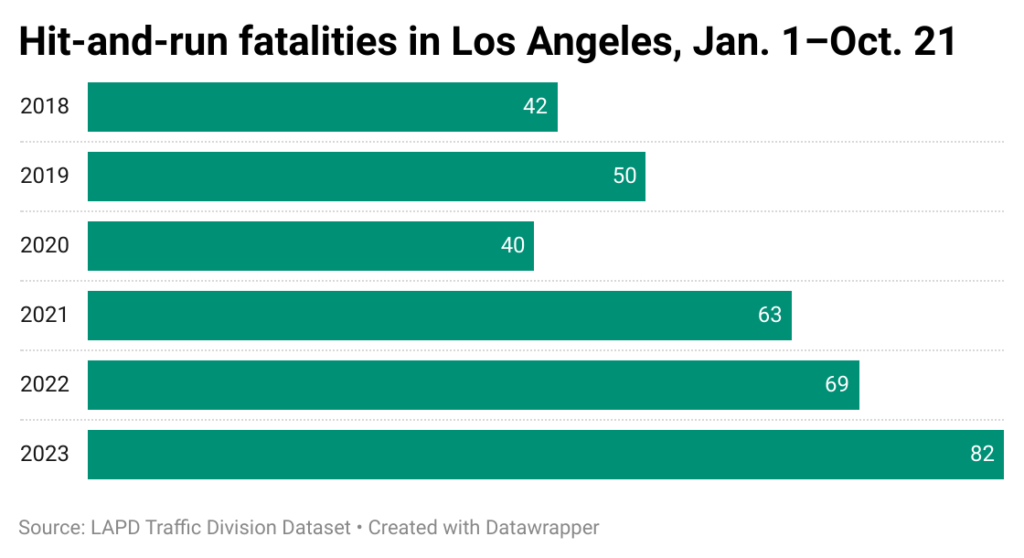
Spike in hit-and-runs
Although anyone involved in a collision is required to pull over, notify emergency services if required and identify themself, the city has experienced an epidemic of drivers who speed away. There have been 82 hit-and-run deaths in Los Angeles this year, according to Traffic Division Compstat data. That is up 30% from the same period in 2021.
The incidents continue unabated. At about 2:25 a.m. on Oct. 29, a black sedan traveling northbound on Western Avenue hit a man riding a scooter near Sierra Vista Avenue in East Hollywood. A silver Lexus then struck the scooter as well. The first driver sped off. The victim died.
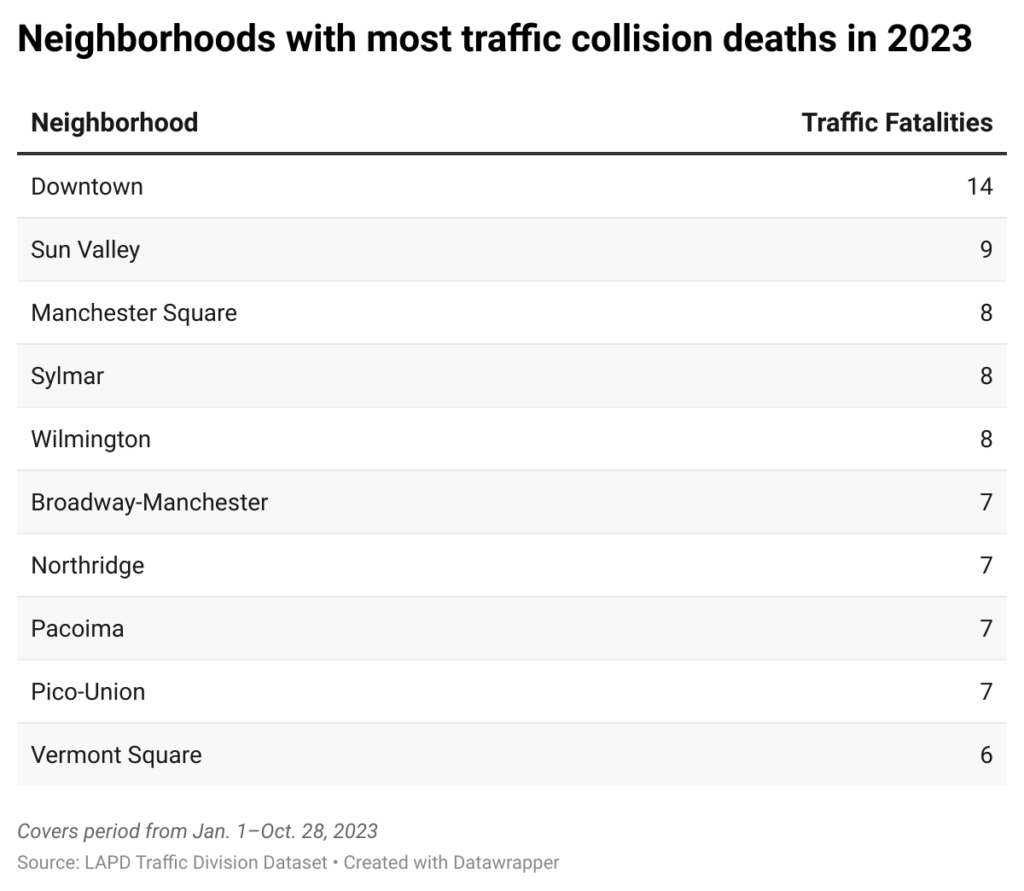
In approximately the first 10 months of the year, car-filled Downtown experienced 14 collision deaths, more than any other neighborhood in the city. The next highest count was the nine fatalities in Sun Valley. Ten neighborhoods recorded more than five deaths.
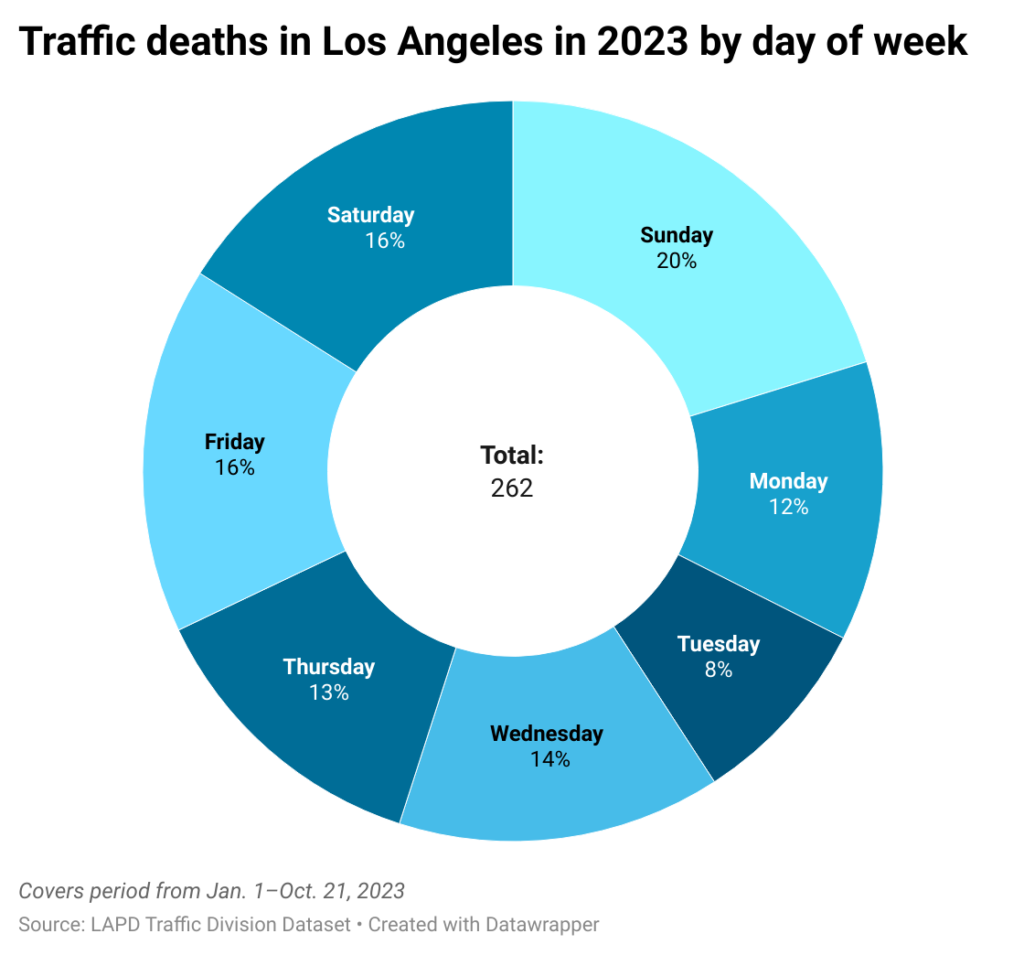
LAPD data shows that the greatest number of fatal collisions happen on weekends. So far this year, 53 deaths, or 20% of the total, occurred on a Sunday. That is more than twice the 21 fatalities recorded on a Tuesday.
According to Traffic Division data, more than 70% of those who died in traffic collisions this year were male. Females accounted for 65 victims.
The street with the highest number of deaths this year is Foothill Boulevard, which runs primarily north of the 210 Freeway in the San Fernando Valley. According to police data, eight people died in collisions, with four of them in the neighborhood of Sylmar. That includes a pair of deaths two weeks apart, on Sept. 7 and 21, at the intersection of Astoria Boulevard.
How we did it: We examined publicly available data from the Los Angeles Police Department Traffic Division from January 1, 2018–Oct. 28, 2023, as well as LAPD Traffic Division Compstat Data. Learn more about our data here.
LAPD data only reflects collisions that are reported to the department, not how many collisions actually occurred. In making our calculations, we rely on the data the LAPD makes publicly available. LAPD may update past collision reports with new information, or recategorize past reports. Those revised reports do not always automatically become part of the public database.
Have questions about our data or want to know more? Write to us at askus@xtown.la.


