

Downtown graffiti grabs headlines, but numbers in Los Angeles stay steady


A dominant story in Los Angeles this year has been the tagging of the trio of abandoned towers across from Crypto.com Arena. The breathless headlines and the bemoaning of what to do about the structures owned by a now-bankrupt Chinese development firm might lead one to believe that no place in the city gets more graffiti than Downtown.
That is not the case. From Jan. 1–Feb. 20, there were 2,951 graffiti clean-up reports in Downtown, making it the second-most tagged neighborhood, according to publicly available MyLA311 data. There was more graffiti just across the Los Angele River: Boyle Heights recorded 3,542 reports, or an average of just under 70 each day.
The trend was the same last year: Boyle Heights got hit the most, registering 27,962 reports in the entirety of 2023. Downtown ranked second.
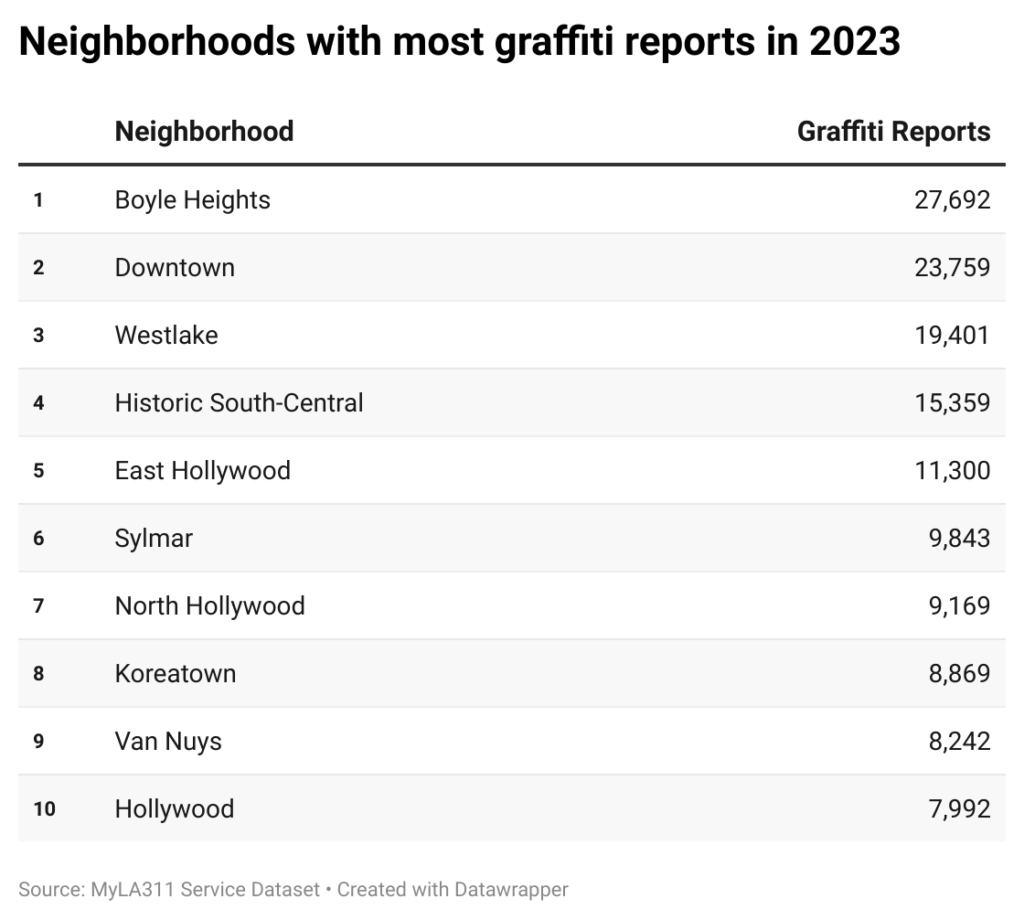
There is a top-heavy tilt to the numbers. Last year, the five neighborhoods with the most calls together accounted for 97,514 reports, or nearly 30% of the graffiti clean-ups in the city.
Doing the clean-up
When graffiti is reported to the MyLA311 system, the city’s Office of Community Beautification arranges for it to be painted over. The office’s goal is to complete the work within 72 hours, but the spray paint or markers are often cleared in a day.
The office contracts with crews working in different parts of the city. According to the office’s website, each of what are labeled Community Based Organizations “utilize persons needing to complete community service hours for the court system. They are supervised by permanent employees of the graffiti removal program.”
Reports can be made by calling 311, or by using the MyLA311 website or app. Official counts include tags that abatement crews see and proactively cover before anyone reports them.
[Get crime, housing and other stats about where you live with the Crosstown Neighborhood Newsletter]
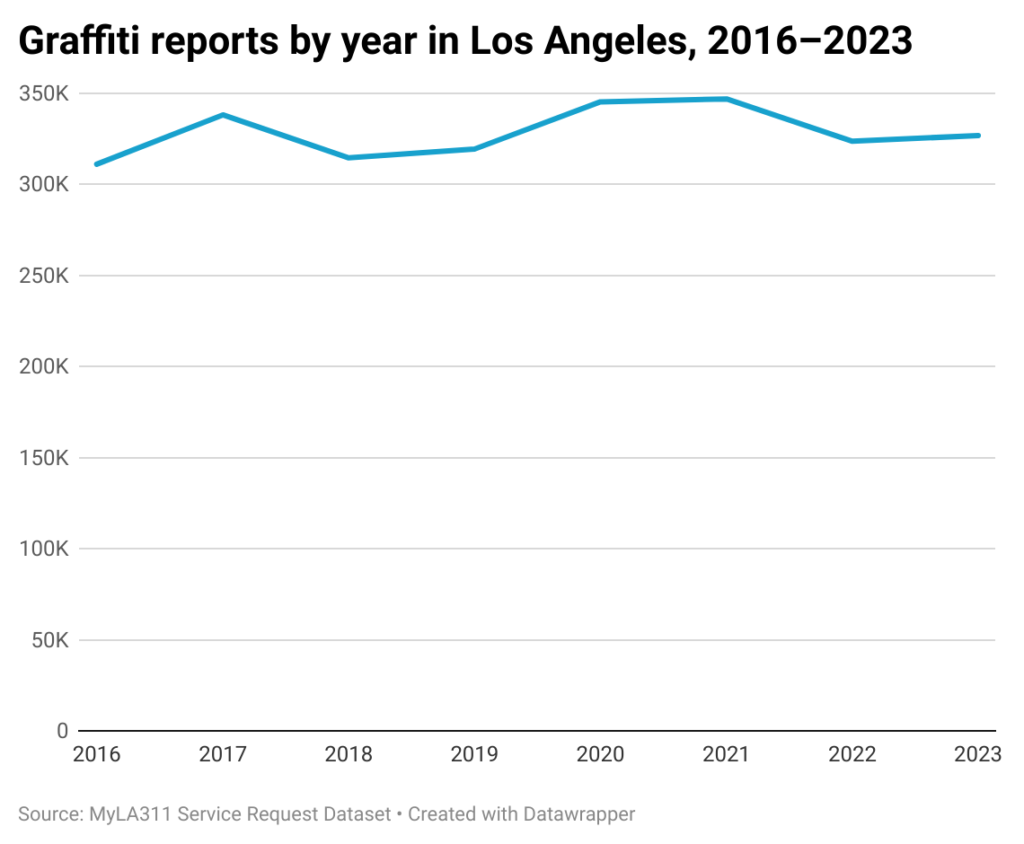
Graffiti counts have been fairly stable over much of the past decade, with generally between 310,000 and 350,000 annual reports. There was a modest spike during the first two pandemic years, but figures have since declined.
Last year there were 326,861 reports, according to MyLA311 data. Although that is slightly higher than the previous year, it is 5.8% below the recent peak, the approximately 347,000 reports tabulated in 2021.
Graffiti complaints last year were highest in June, when 32,730 reports were made. That proved to be a brief spike, as the count was below 27,000 in each of the next three months.
In response to the tagging at Oceanwide Plaza, the City Council recently voted to allocate $3.8 million to fence off the towers and clean the graffiti. The fencing has begun.
The motion was authored by Downtown Councilman Kevin de Leon. The city will seek to recover the money from the developer, though it is unclear if that is possible.
How we did it: We examined publicly available MyLA311 service data from Jan. 1, 2016–Feb. 20, 2024. For neighborhood boundaries, we rely on the borders defined by the Los Angeles Times. Learn more about our data here.
MyLA311 service data only reflects reports made to the city of Los Angeles, not how many actually occurred. In making our calculations, we rely on the data the city makes publicly available. Past reports may be updated with new information. Those revised reports do not always automatically become part of the public database.
Have questions about our data or want to know more? Write to us at askus@xtown.la.


