

Los Angeles roads remain deadly in first quarter


Despite years of public information campaigns, road improvements and outright pleas for safer driving, the streets of Los Angeles have become increasingly deadly.
There were 343 traffic fatalities in the city in 2023, the third consecutive annual increase and the highest count in at least a decade. The total exceeded the number of murders.
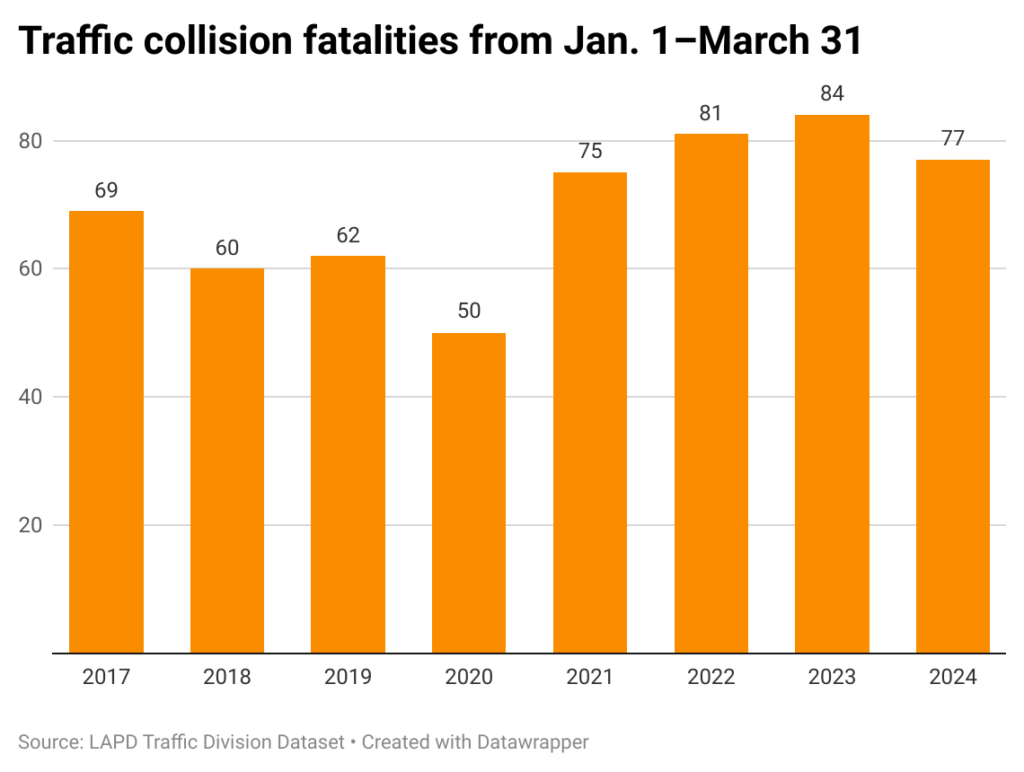
The count is down slightly in the first three months of 2024, with 77 deaths, according to publicly available data from the Los Angeles Police Department’s Traffic Division. Last year there were 84 fatalities in the period (numbers can be revised upwards later if an injured individual dies).
However, the first-quarter figure exceeds totals in the same period in the years before the pandemic.
The week of Feb. 25–March 2 was particularly tragic, with 10 people killed. The victims included a 65-year-old woman struck on Crenshaw Boulevard in South Los Angeles. The driver sped off without stopping, in what the LAPD classified as a hit-and-run.
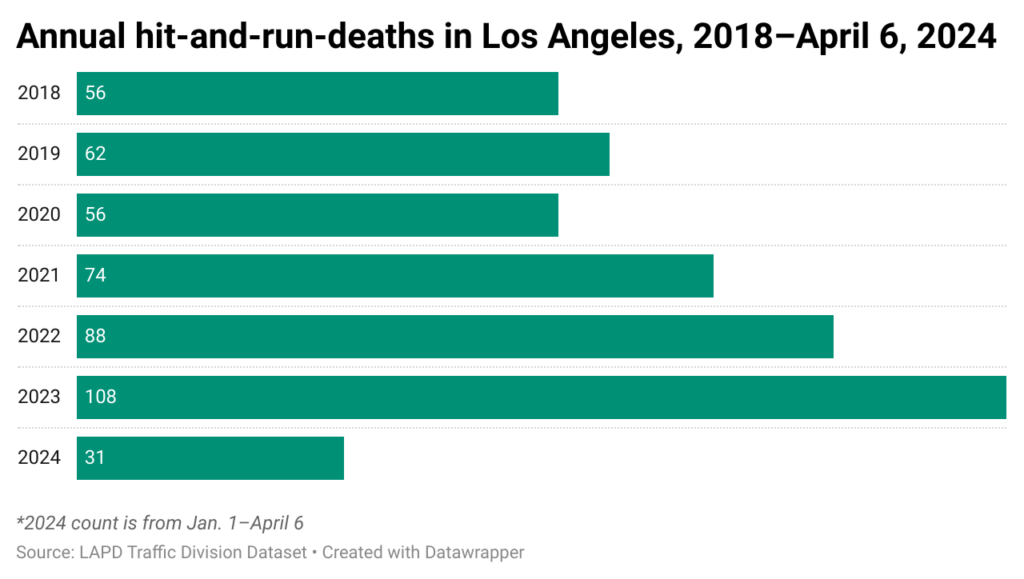
That is one of 31 hit-and-run fatalities this year, according to a Traffic Division Compstat report. Those type of deaths have soared in the past five years, from 62 in the entirety of 2019, to 108 last year.
Failing to reverse the trend
Local leaders have struggled to reduce traffic fatalities. In 2015, Mayor Eric Garcetti launched the Vision Zero initiative, with the aim to eliminate such deaths by 2025.
[Get crime, housing and other stats about where you live with the Crosstown Neighborhood Newsletter]
In 2015 there were 186 deaths on Los Angeles roads. Yet the annual toll has not decreased. In fact, the count has surpassed 300 for each of the last three full years.
Los Angeles is not alone, as traffic deaths have increased in other cities and states. The rise has been attributed to multiple factors, including people driving larger, heavier vehicles, which inflict greater damage, particularly when a pedestrian is struck.
Then there is distracted driving, including people texting while behind the wheel. Similarly, blame has been directed at pedestrians who cross the street while staring at a phone, instead of any vehicles coming their way.
Additionally, there have been more deaths of people not wearing seatbelts.
Whatever the contributing factors, the situation worsened toward the end of 2023. In the five-year period from 2018–2022, there were four separate months with 30 or more deaths, according to Traffic Division data. Yet that level was eclipsed for five consecutive months starting last September. The peak was the 36 deaths in October.
Fatalities in many neighborhoods
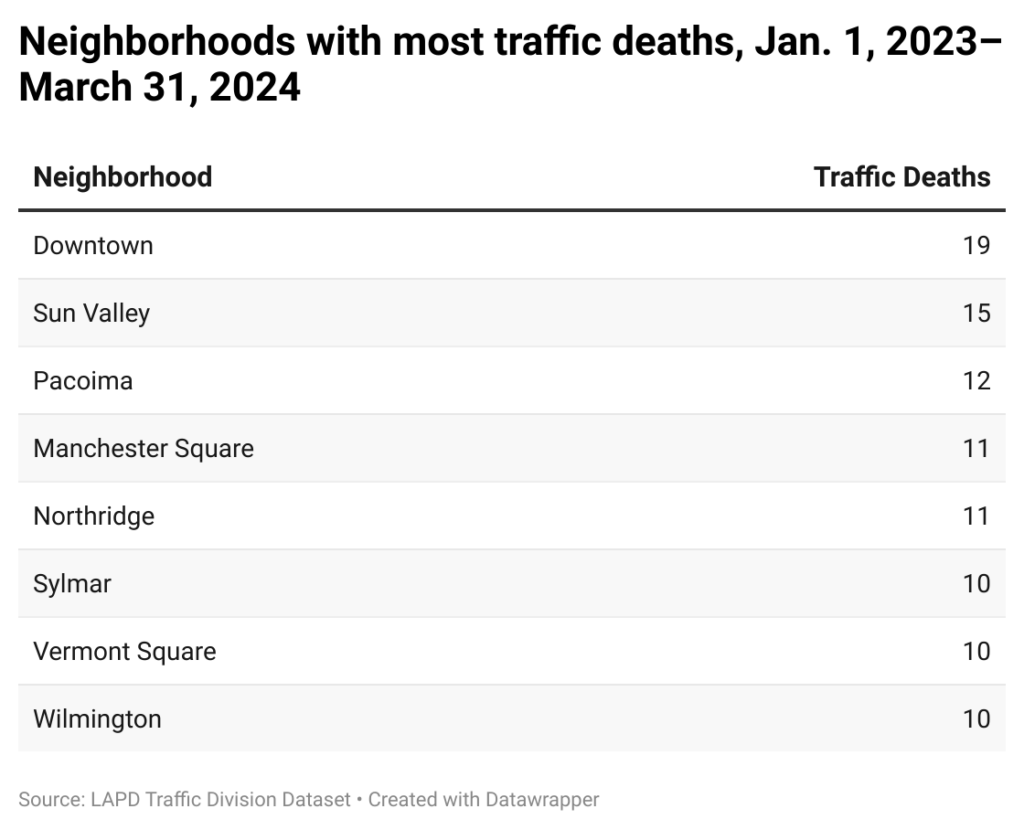
When it comes to automobile-related data, traffic-clogged Downtown tends to have the highest counts. That extends to vehicular deaths. In the 15-month period from Jan. 1, 2023–March 31, 2024, there were 19 such fatalities in the community.
Yet collision deaths occur in disturbing numbers across the city. In that same time period, eight neighborhoods recorded double-digit deaths. They ranged from the San Fernando Valley to South L.A.
Of the 343 collision deaths last year, 184 of them, or 54%, involved someone struck by a vehicle. That remains the case in 2024: 39 of the 77 fatalities were the result of a vehicle–pedestrian collision.
Just last week, a woman in her 30s was killed after being hit by a white van in Northridge. According to the LAPD, she was pushing a shopping cart shortly before 3 a.m. on April 15 when she was struck on Tampa Avenue. The driver sped away.
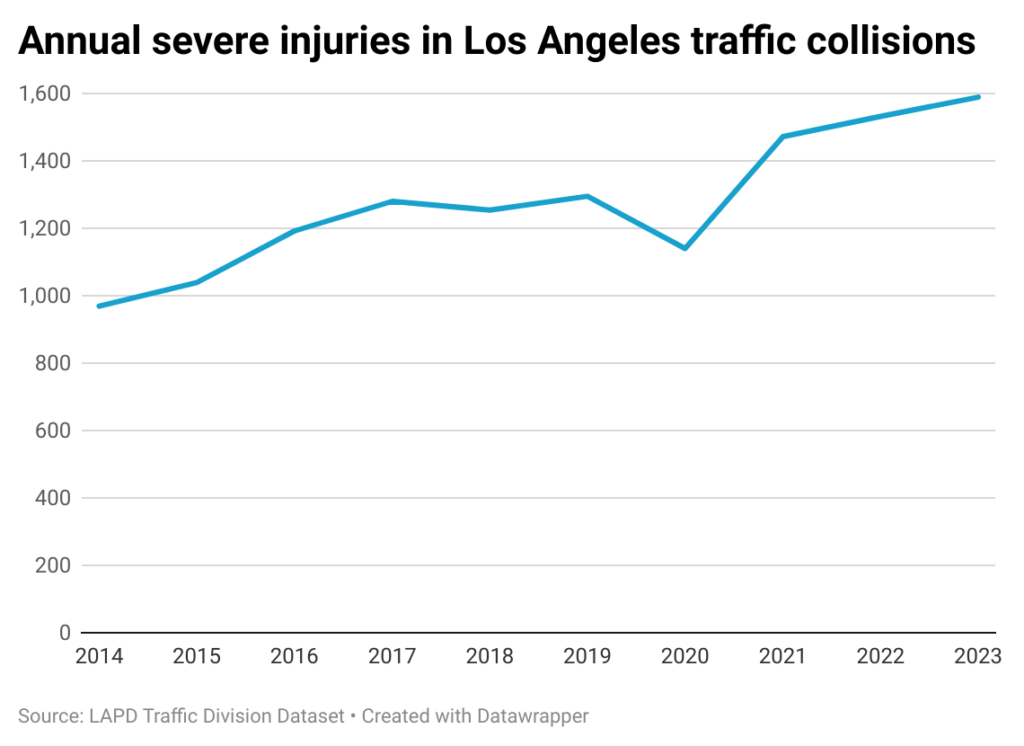
Many collisions that do not result in a death still have serious consequences. According to police data, the LAPD last year recorded 1,589 instances of a “severe” injury resulting from a collision. That is a 64% increase over the count in 2014.
Automobiles can also be dangerous to those on two wheels, particularly in a city with limited bicycle infrastructure. So far this year, 32 cyclists suffered severe injuries after colliding with a car, and three died.
How we did it: We examined publicly available collision data from the Los Angeles Police Department Traffic Division from January 1, 2010–March 31, 2024, as well as LAPD Traffic Division Compstat Data. Learn more about our data here.
LAPD data only reflects collisions that are reported to the department, not how many collisions actually occurred. In making our calculations, we rely on the data the LAPD makes publicly available. LAPD may update past collision reports with new information, or recategorize past reports. Those revised reports do not always automatically become part of the public database.
Have questions about our data or want to know more? Write to us at askus@xtown.la.


