

What’s hot and what’s not? Revealing the uneven shifts in the L.A. housing market


(Image generated with MidJourney)
Real estate across Los Angeles County has been on a tear, with the assessed value of residential property rising, on average, by 54% over the past eight years.
But those gains are not distributed equally, and an examination of publicly available data reveals some surprises as to which areas have seen values spike.
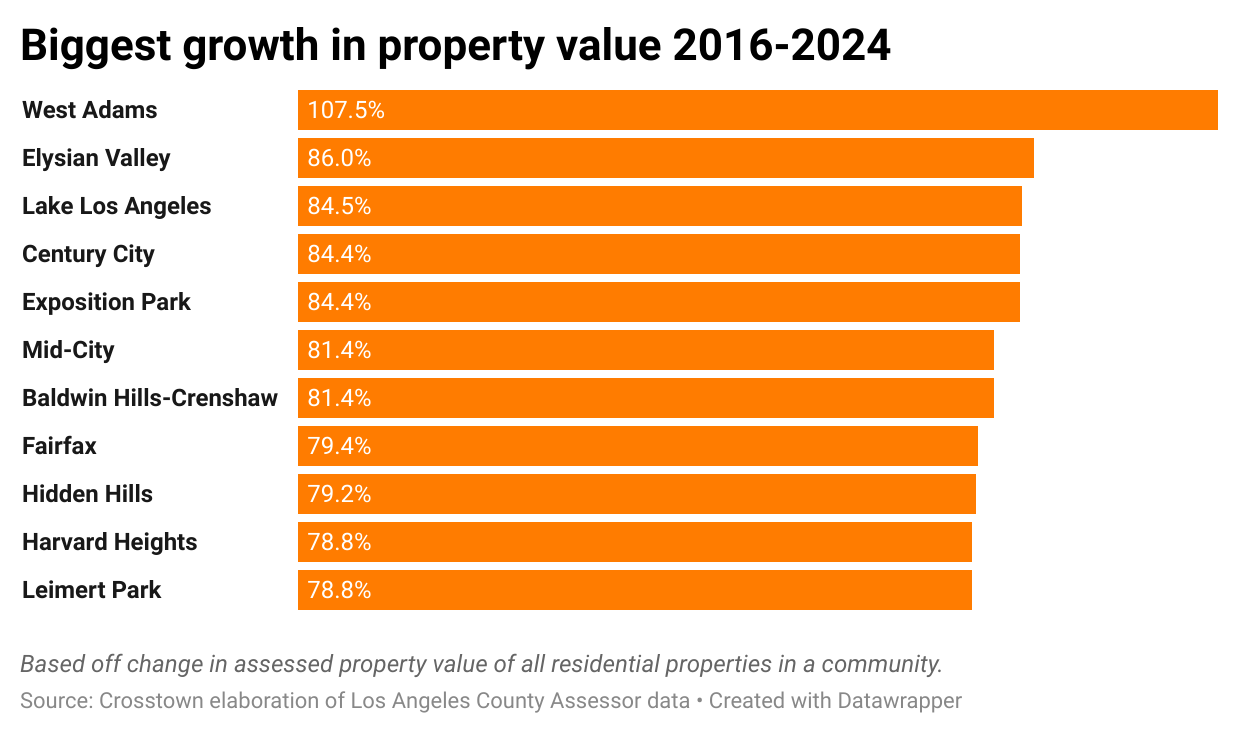
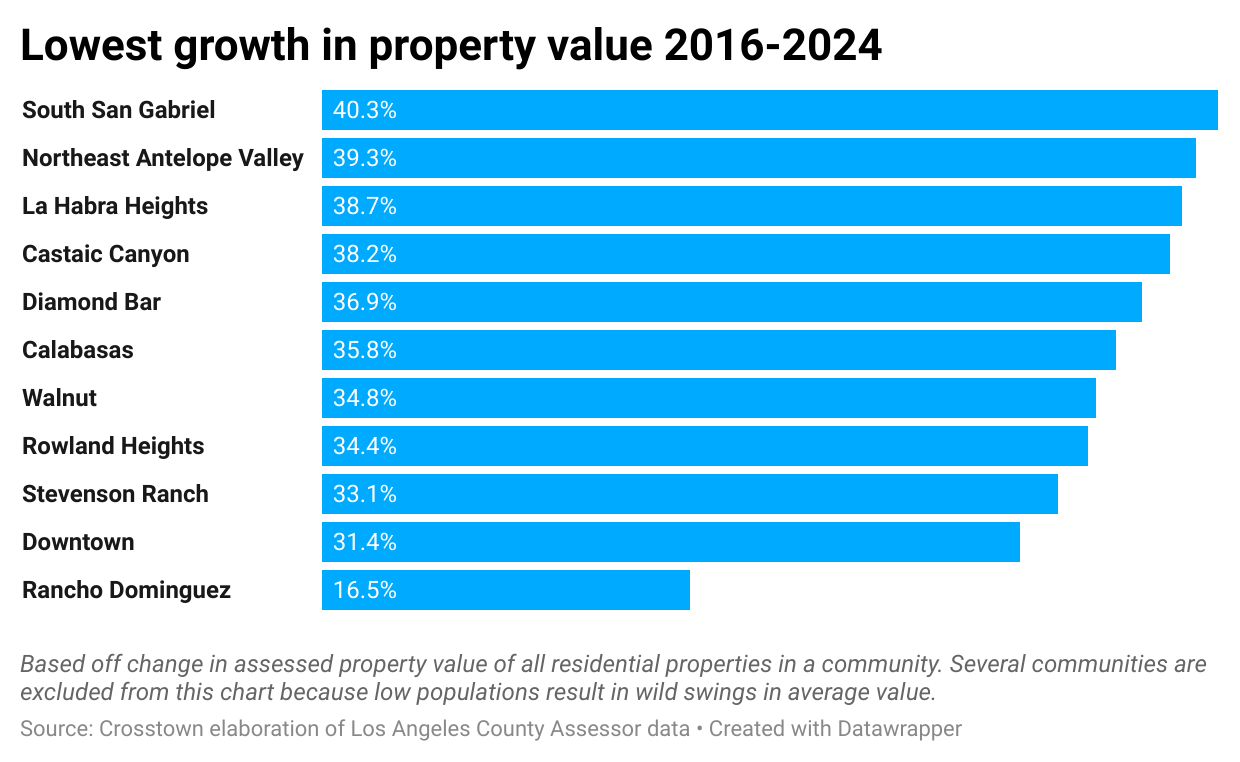
The hottest real estate market in all of Los Angeles County? West Adams, a residential neighborhood hugging the 10 freeway in central Los Angeles. Real estate values have jumped by 107%. Meanwhile, in Calabasas, home to several Kardashians, values have increased by only a third of that amount, 35.7%.
Mapping the uneven gains in real estate values across the county offers a view into where property wealth has been generated and where it has just kept pace. Real estate investors make hefty bets on neighborhoods they believe are about to pop. And places that record sudden gains also often see other changes as well, such as displacement of long-time renters and businesses.
Crosstown analyzed the tax values of residential properties between 2016 and 2024 from the Los Angeles County Assessor to determine where real estate prices have risen the most and the least. The list of 265 different communities across the county’s 4,000 square miles shows a wide variation, though even the laggards performed well—157 of those communities registered a boost of 50% or more. (Scroll down for an explanation of our methodology. Scroll down further to see where your community ranks.)
West Adams’s meteoric rise places it at No. 1. Long Beach, which jumped an impressive 52%, falls right in the middle. Downtown, which boomed during the early 2000s, is close to the bottom, though values still rose at 45%.
Million-dollar fixer-upper
At a property on Carmona Avenue, just south of Adams Boulevard, probate specialist Demetrius Green is hoping his client isn’t too late to cash in on the steep run-up in home prices in West Adams. The front yard of the three-bedroom house he is showing to prospective buyers is covered by a layer of chipped concrete. Inside, patchy yellow paint, scuffed floors and a bare-bones kitchen indicate that it’s in dire need of a remodel. The current asking price: $1.1 million.
“The West Adams district has become very, very popular over the past three to four years,” said Green. “Investors looking to maximize their profits look for an area that has pretty much been stagnant.”
Timing is everything in real estate investing. While values in West Adams spiked more than anywhere else over the past eight years, other neighborhoods have had similar jumps in previous periods. Residents of Eastside neighborhoods such as Silver Lake, Eagle Rock and Highland Park can recite how values began soaring in the 1990s and early 2000s, meaning that homes today go for three or four times what they did a few decades ago.
When once working-class or even marginal communities transform into desirable destinations, values rise and seven-figure sales become the norm. Buyers and investors then start looking for more affordable options elsewhere.
Risks for renters
The dramatic shift presents a familiar socioeconomic challenge: Homeowners in the neighborhood see their wealth rise, while renters, including families who have lived in the area for generations, find themselves priced out.
Jimmy “J.T.” Recinos has run the Jimbo Times, an online archive covering the housing crisis in Central L.A., for over a decade. He says South Los Angeles has typically been a place people move to in search of more affordable housing. “Market-rate housing is coming in at a time when we could use far more extremely low-income housing, multi-family housing,” he said. “I’ve seen the way that families have just left the neighborhood all together.”
In a recent study by Realtor.com, California ranked second to last in housing affordability. (Hawaii is the worst.) Data from the California Association of Realtors shows that Los Angeles is the fourth most expensive county in southern California to buy a single-family home in, behind Orange, San Diego and Ventura.
In the city of Los Angeles, however, the situation is particularly dire due to zoning restrictions that make it difficult to build, high labor costs and other factors that further constrain housing supply.
The city of Los Angeles has set a goal of adding 456,643 new housing units this decade. It’s nowhere close to meeting that goal. Last year, it permitted only 7,038 new apartment units (the lowest number in a decade) and 1,545 new single-family homes.
Shane Phillips is a researcher and policy analyst at the UCLA Lewis Center for Regional Policy Studies and the author of “Affordable City,” which offers a blueprint for cities to ramp up supply without displacing tenants. Rents relative to incomes in Los Angeles, he said, “are about as bad as it gets.”
He notes that in his neighborhood of Lincoln Heights, household incomes hover at around $60,000, while the median price for a home there is around $700,000. “Existing housing is not affordable to the people who live here now,” he said.
The city’s planning policies, which place heavy restrictions on where big housing projects can be built, make gentrification almost inevitable. Apartment blocks can only be erected in a small number of neighborhoods in Los Angeles which are often already filled with low-income renters. “What you’re basically saying is, ‘We want you to build housing where it is most likely to displace poor renters,’ and that is the policy that we have in Los Angeles,” Phillips said.
Small rise at the top
In the Crosstown analysis, very few of the region’s swankiest communities registered high on the list. The exclusive enclave of Bel Air, for example, has the highest home values per resident of any place in the county, coming in at $2,035,000. But on the list of biggest percent change increase over the past eight years, Bel Air is No. 68, with a jump of 61%.
There are several reasons why. First, home prices in wealthy areas were already sky high, which means they often have less room to rise.
In more modestly priced neighborhoods, on the other hand, homes that sold for $700,000 a few years ago may be considered within range of more buyers, creating greater price competition. Leimert Park, a historically Black neighborhood in central Los Angeles, was considered one of the few remaining affordable neighborhoods in the city. Property values there have risen by 79%, making it No. 11 on the list.
Where might prices spike next? There are a number of Los Angeles communities that have not seen meaningful property value growth in some time. These include Historic South-Central, which came in at No. 232 on this list, the tiny cities of Bell, at No. 240, and Maywood, at 246. The average assessed value of residential properties in all three areas is still below $200,000.
How we did it: In order to come up with our rankings, Crosstown compiled the assessed tax value of every residential unit over the past eight years from the Los Angeles County Office of the Assessor. We then separated out those units into 273 different communities. Those communities include cities, such as Diamond Bar and Santa Clarita, but also 114 different neighborhoods within the city of Los Angeles, such as Sherman Oaks and San Pedro. We divided the total assessed value of each community by the number of residential units, allowing us to account for multi-unit properties, such as apartment complexes. That allowed us to compare the change in average assessed value between 2016 and 2024.
Our calculations are based on tax assessments of the properties. That’s different from the price a property might fetch if it were listed for sale today. The assessed value of a property increases only slightly each year unless an event triggers a new assessment, such as a sale or major renovations. In this way, our method allows us to zero in on the communities which have seen the most real-estate activity and the steepest increases.
Have questions about our data? Just write to us at askus@xtown.la
The list:
Below is the of list of the change in assessed value of residential property in 265 communities in Los Angeles County
| Community | Average value per unit | % change 2016-2024 |
| west-adams | 304,379 | 107.45% |
| elysian-valley | 321,630 | 85.96% |
| lake-los-angeles | 196,820 | 84.51% |
| century-city | 1,570,411 | 84.43% |
| exposition-park | 234,264 | 84.38% |
| mid-city | 342,940 | 81.37% |
| baldwin-hillscrenshaw | 248,476 | 81.35% |
| fairfax | 572,292 | 79.38% |
| hidden-hills | 4,320,372 | 79.20% |
| harvard-heights | 248,684 | 78.83% |
| leimert-park | 304,546 | 78.80% |
| desert-view-highlands | 221,187 | 77.77% |
| angeles-crest | 523,546 | 75.72% |
| echo-park | 301,503 | 75.03% |
| university-park | 206,296 | 74.70% |
| griffith-park | 2,318,535 | 74.56% |
| lake-hughes | 238,031 | 73.98% |
| malibu | 3,788,524 | 73.74% |
| east-hollywood | 185,048 | 72.69% |
| silver-lake | 454,522 | 72.37% |
| highland-park | 287,765 | 71.21% |
| mar-vista | 565,407 | 71.17% |
| sepulveda-basin | 717,286 | 70.74% |
| chesterfield-square | 253,175 | 70.35% |
| hollywood | 276,017 | 69.62% |
| beverly-grove | 605,716 | 69.53% |
| chatsworth | 655,055 | 69.52% |
| sun-village | 252,389 | 68.30% |
| vermont-knolls | 193,313 | 68.20% |
| adams-normandie | 198,033 | 68.16% |
| mayflower-village | 424,727 | 67.88% |
| jefferson-park | 220,473 | 67.69% |
| watts | 234,388 | 67.64% |
| eagle-rock | 427,305 | 67.61% |
| cypress-park | 217,339 | 67.60% |
| gramercy-park | 280,900 | 67.11% |
| littlerock | 225,247 | 66.67% |
| boyle-heights | 168,383 | 66.28% |
| willowbrook | 232,733 | 66.06% |
| green-meadows | 228,220 | 65.66% |
| mount-washington | 530,049 | 65.62% |
| west-hollywood | 424,995 | 65.19% |
| glassell-park | 332,207 | 65.00% |
| lancaster | 253,580 | 64.79% |
| culver-city | 512,428 | 64.76% |
| pico-union | 160,146 | 64.47% |
| encino | 858,071 | 63.98% |
| beverlywood | 1,342,864 | 63.80% |
| vermont-square | 213,716 | 63.75% |
| hyde-park | 246,029 | 63.62% |
| arlington-heights | 221,343 | 63.58% |
| cheviot-hills | 1,436,019 | 63.47% |
| hawaiian-gardens | 242,337 | 63.12% |
| atwater-village | 342,984 | 62.94% |
| manchester-square | 244,092 | 62.66% |
| compton | 230,804 | 62.63% |
| vermont-vista | 199,327 | 62.55% |
| santa-fe-springs | 313,903 | 62.44% |
| el-sereno | 264,397 | 62.07% |
| chinatown | 252,850 | 62.02% |
| broadway-manchester | 204,772 | 62.02% |
| harvard-park | 233,727 | 61.87% |
| hermosa-beach | 988,729 | 61.85% |
| south-el-monte | 267,540 | 61.79% |
| gardena | 287,120 | 61.78% |
| elysian-park | 229,548 | 61.51% |
| rancho-park | 654,807 | 61.36% |
| bel-air | 4,297,583 | 61.09% |
| quartz-hill | 278,281 | 61.06% |
| hansen-dam | 1,049,263 | 61.04% |
| los-feliz | 454,159 | 60.62% |
| el-segundo | 568,076 | 60.55% |
| view-park-windsor-hills | 493,536 | 60.43% |
| industry | 372,316 | 60.08% |
| manhattan-beach | 1,582,481 | 59.63% |
| westmont | 181,165 | 59.53% |
| valley-village | 389,707 | 59.29% |
| vermont-slauson | 196,857 | 59.20% |
| montecito-heights | 374,108 | 59.17% |
| florence | 198,215 | 59.12% |
| sawtelle | 413,509 | 58.75% |
| beverly-hills | 1,996,858 | 58.51% |
| south-pasadena | 571,125 | 58.50% |
| north-hollywood | 271,469 | 58.39% |
| inglewood | 233,935 | 58.30% |
| hollywood-hills-west | 1,788,364 | 58.30% |
| montebello | 291,934 | 58.05% |
| larchmont | 449,639 | 57.97% |
| athens | 261,853 | 57.85% |
| toluca-lake | 654,278 | 57.26% |
| venice | 762,708 | 57.05% |
| mission-hills | 348,866 | 56.78% |
| green-valley | 282,098 | 56.72% |
| palms | 267,333 | 56.69% |
| hollywood-hills | 705,724 | 56.63% |
| beverly-crest | 3,588,510 | 56.52% |
| east-la-mirada | 346,865 | 56.41% |
| del-rey | 525,535 | 55.98% |
| east-los-angeles | 188,671 | 55.90% |
| florence-firestone | 181,539 | 55.75% |
| pacific-palisades | 2,275,679 | 55.64% |
| van-nuys | 245,663 | 55.53% |
| altadena | 554,945 | 55.52% |
| pico-robertson | 466,775 | 55.48% |
| palmdale | 274,739 | 55.27% |
| sherman-oaks | 607,126 | 55.20% |
| koreatown | 211,337 | 55.11% |
| topanga | 1,161,629 | 55.02% |
| westchester | 584,397 | 54.85% |
| sunland | 394,849 | 54.79% |
| harbor-city | 290,098 | 54.78% |
| carthay | 559,143 | 54.76% |
| hancock-park | 1,108,248 | 54.47% |
| northwest-palmdale | 496,574 | 54.29% |
| harbor-gateway | 250,930 | 53.89% |
| westlake | 171,713 | 53.84% |
| west-carson | 381,821 | 53.43% |
| santa-monica | 656,390 | 53.41% |
| lincoln-heights | 194,802 | 53.25% |
| studio-city | 692,058 | 53.08% |
| commerce | 224,213 | 53.05% |
| lake-view-terrace | 415,131 | 52.87% |
| covina | 343,835 | 52.82% |
| whittier | 388,379 | 52.72% |
| central-alameda | 187,162 | 52.72% |
| valley-glen | 305,745 | 52.51% |
| san-pedro | 346,337 | 52.22% |
| la-puente | 277,753 | 52.21% |
| long-beach | 329,137 | 51.86% |
| west-compton | 243,549 | 51.81% |
| windsor-square | 1,091,204 | 51.80% |
| burbank | 412,606 | 51.79% |
| lake-balboa | 393,353 | 51.68% |
| shadow-hills | 586,100 | 51.53% |
| sierra-madre | 627,823 | 51.48% |
| rolling-hills-estates | 1,194,409 | 51.34% |
| east-pasadena | 827,468 | 51.25% |
| la-crescenta-montrose | 582,968 | 51.17% |
| lennox | 183,131 | 50.97% |
| carson | 313,535 | 50.87% |
| norwalk | 307,752 | 50.77% |
| south-whittier | 325,427 | 50.68% |
| north-hills | 317,414 | 50.68% |
| vincent | 346,324 | 50.49% |
| tujunga | 376,322 | 50.41% |
| charter-oak | 279,058 | 50.38% |
| tarzana | 659,472 | 50.38% |
| azusa | 309,927 | 50.38% |
| lakewood | 402,499 | 50.35% |
| ladera-heights | 679,419 | 50.34% |
| redondo-beach | 630,945 | 50.31% |
| lopezkagel-canyons | 299,034 | 50.30% |
| west-hills | 596,671 | 50.22% |
| torrance | 480,427 | 50.21% |
| east-compton | 238,694 | 50.20% |
| artesia | 348,765 | 50.15% |
| pomona | 270,444 | 50.04% |
| pico-rivera | 275,951 | 49.95% |
| granada-hills | 487,668 | 49.90% |
| pasadena | 526,217 | 49.83% |
| la-canada-flintridge | 1,449,853 | 49.81% |
| pacoima | 274,341 | 49.79% |
| unincorporated-santa-monica-mountains | 1,707,691 | 49.75% |
| san-pasqual | 600,800 | 49.58% |
| winnetka | 351,160 | 49.37% |
| canoga-park | 255,123 | 49.31% |
| playa-vista | 850,873 | 49.28% |
| playa-del-rey | 624,583 | 49.26% |
| west-whittier-los-nietos | 317,899 | 49.24% |
| south-park | 175,283 | 49.13% |
| hasley-canyon | 771,438 | 49.11% |
| monrovia | 405,162 | 48.78% |
| bellflower | 254,439 | 48.70% |
| woodland-hills | 580,988 | 48.53% |
| northwest-antelope-valley | 370,348 | 48.49% |
| huntington-park | 168,612 | 48.45% |
| wilmington | 205,751 | 48.30% |
| southeast-antelope-valley | 349,216 | 48.26% |
| cudahy | 153,693 | 48.01% |
| del-aire | 454,661 | 47.89% |
| citrus | 329,237 | 47.82% |
| glendora | 466,780 | 47.78% |
| brentwood | 1,800,926 | 47.63% |
| south-san-jose-hills | 181,506 | 47.63% |
| lomita | 345,231 | 47.59% |
| irwindale | 228,050 | 47.47% |
| lawndale | 269,316 | 47.43% |
| west-san-dimas | 835,065 | 47.34% |
| north-el-monte | 452,958 | 47.33% |
| reseda | 307,532 | 47.28% |
| west-los-angeles | 692,465 | 47.19% |
| elizabeth-lake | 296,978 | 47.11% |
| paramount | 206,320 | 47.09% |
| la-mirada | 430,156 | 47.07% |
| west-covina | 380,640 | 47.05% |
| panorama-city | 225,527 | 47.04% |
| sylmar | 353,682 | 46.85% |
| west-puente-valley | 318,605 | 46.83% |
| mid-wilshire | 307,317 | 46.79% |
| downey | 350,131 | 46.68% |
| acton | 531,446 | 46.48% |
| hawthorne | 235,992 | 46.38% |
| rancho-palos-verdes | 998,495 | 46.30% |
| leona-valley | 456,763 | 46.19% |
| glendale | 402,020 | 45.94% |
| san-fernando | 260,539 | 45.91% |
| monterey-park | 379,201 | 45.88% |
| agua-dulce | 638,174 | 45.87% |
| baldwin-park | 276,342 | 45.86% |
| sun-valley | 283,686 | 45.65% |
| el-monte | 258,014 | 45.60% |
| east-san-gabriel | 460,496 | 45.47% |
| northridge | 409,447 | 45.47% |
| westwood | 852,154 | 45.37% |
| palos-verdes-estates | 1,845,925 | 45.33% |
| alondra-park | 298,590 | 45.33% |
| avocado-heights | 355,379 | 45.14% |
| val-verde | 339,788 | 45.07% |
| valinda | 330,283 | 45.02% |
| claremont | 531,411 | 44.95% |
| santa-clarita | 452,648 | 44.77% |
| tujunga-canyons | 791,684 | 44.72% |
| temple-city | 524,018 | 44.69% |
| duarte | 357,087 | 44.60% |
| unincorporated-santa-susana-mountains | 1,005,899 | 44.53% |
| ramona | 997,007 | 44.49% |
| lynwood | 220,553 | 44.25% |
| arleta | 347,666 | 44.22% |
| alhambra | 320,710 | 44.17% |
| la-verne | 403,455 | 44.16% |
| bell-gardens | 165,364 | 44.06% |
| historic-south-central | 190,553 | 43.91% |
| north-whittier | 463,500 | 43.79% |
| westlake-village | 937,544 | 43.74% |
| san-dimas | 448,045 | 43.64% |
| san-gabriel | 410,504 | 43.56% |
| castaic | 512,668 | 43.54% |
| hacienda-heights | 474,010 | 43.24% |
| rolling-hills | 2,382,709 | 43.18% |
| bell | 175,485 | 43.08% |
| avalon | 451,752 | 42.90% |
| south-gate | 230,159 | 42.83% |
| san-marino | 1,807,253 | 42.65% |
| walnut-park | 239,049 | 42.36% |
| rosemead | 325,263 | 42.13% |
| maywood | 162,026 | 42.00% |
| arcadia | 884,981 | 41.53% |
| signal-hill | 395,569 | 41.43% |
| porter-ranch | 679,133 | 41.31% |
| cerritos | 504,307 | 41.26% |
| agoura-hills | 719,594 | 40.62% |
| south-san-gabriel | 376,890 | 40.30% |
| northeast-antelope-valley | 227,055 | 39.32% |
| whittier-narrows | 376,237 | 39.25% |
| la-habra-heights | 926,614 | 38.71% |
| castaic-canyons | 673,894 | 38.18% |
| diamond-bar | 595,677 | 36.88% |
| calabasas | 1,097,063 | 35.75% |
| walnut | 704,968 | 34.80% |
| chatsworth-reservoir | 743,422 | 34.74% |
| rowland-heights | 465,472 | 34.44% |
| bradbury | 2,650,654 | 33.69% |
| stevenson-ranch | 674,838 | 33.08% |
| downtown | 437,697 | 31.40% |
| rancho-dominguez | 43,831 | 16.54% |


