

L.A.’s blurry crime picture


In an election year, crime is usually front and center. But in this year’s mayoral campaign the issue has barely broken through. In part, that might be because data indicates the city is safer than it was a year ago.
That’s the good news. The bad news? There is a drought of detailed crime statistics in Los Angeles. That’s because for the past 26 months the Los Angeles Police Department has failed to publish accurate crime data.
The crime data began to go offline in March 2024 for what was supposed to be a six-month hiatus while the LAPD migrated to a new records management system. Yet, almost two years beyond the original deadline, there is no resolution.
In fact, the LAPD is telling two different stories about crime. One comes from the official Compstat division that tallies up only major crimes citywide and in the 21 different divisions. According to this version, last year there were 19,556 stolen vehicle reports.
The other version comes from the raw crime data published on the city’s Open Data website. This is how Crosstown previously parsed the individual crime reports by neighborhood. According to the LAPD’s data, there were 15,017 stolen vehicles last year–a difference of more than 4,500 missing vehicles.
In the first three months of this year, the LAPD’s Open Data numbers report 909 residential burglaries. According to Compstat, there were 1,382, or 52% more.
LAPD leadership was unaware of the discrepancy until Crosstown pointed it out in February. Since then, Crosstown has held several meetings with department officials who have been unable to explain why the gap persists.
Get your very own data about your Los Angeles neighborhood right here. It’s free!
Downward trend
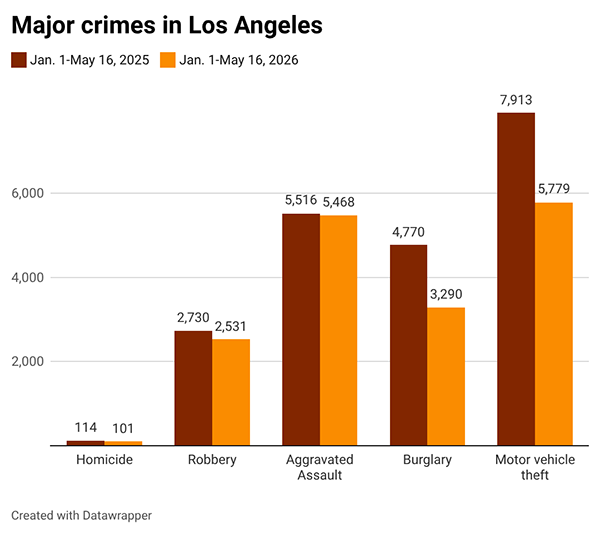
Reported crime is down on a year-to-year basis in every major category, including a 31% drop in burglaries. To understand this data, some context is needed.
Between 2010 and 2015, overall crime decreased slightly each year in Los Angeles. Then, in 2016 there was a spike. Other major U.S. cities saw a similar bump that year. After that, it declined steadily through 2019. Then COVID hit.
The pandemic and the lockdown scrambled everyone’s calculus about crime. With so many people shut inside, overall crime was down. But some types of crime exploded, such as automobile theft and catalytic converter theft. Gun violence also surged. As the pandemic waned, so did those numbers. But in some categories, such as auto theft, the numbers remain persistently high.
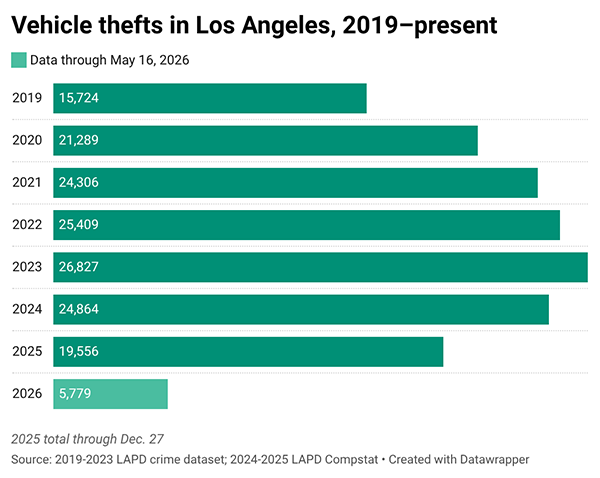
Last year’s auto theft numbers were still 24% higher than in the pre-pandemic year of 2019.
Home invasions
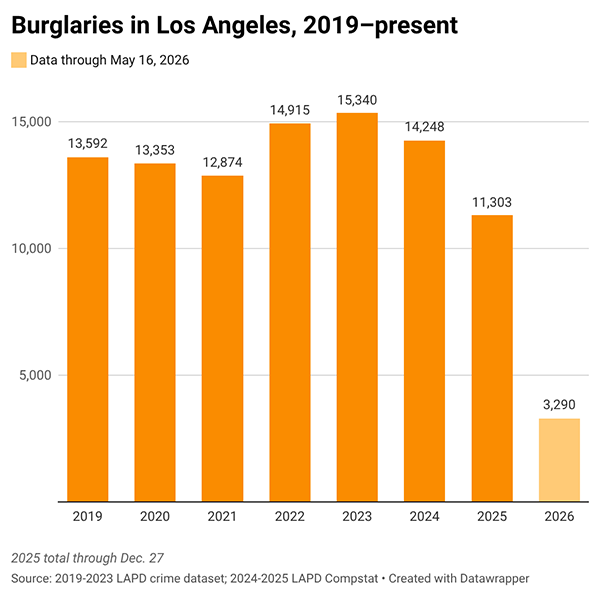
Burglaries have come way down over the past few years (though some people complain that slow LAPD response times mean fewer people bother to report burglaries). Last year’s total of 11,303 break ins was a 17% drop from 2019. This year’s trendline is even better.
Burglary hot spots tend to move around the city. In the past few years, expert burglary rings from Chile and other South American countries have targeted different neighborhoods, hitting multiple homes before moving on. So a drop in burglaries citywide doesn’t necessarily mean that there is a decrease in every Los Angeles neighborhood.
Homicides
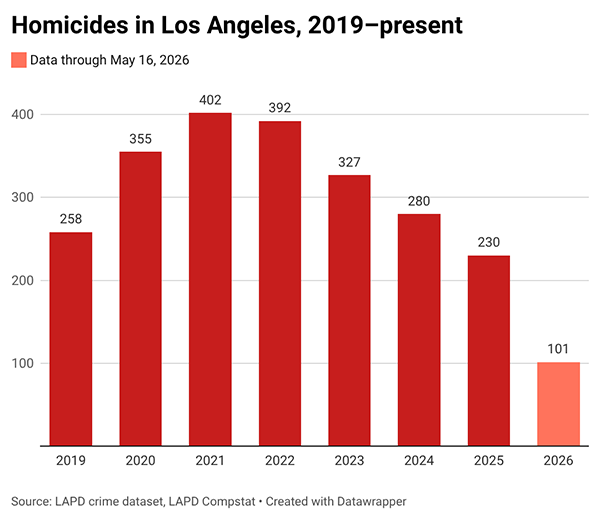
In the early 1990s, there were years with more than 2,000 homicides in the city. Last year, Los Angeles reported 230 murders, the lowest in decades. The numbers continue to fall this year, as the intense gun violence that punctuated the COVID period subsides.
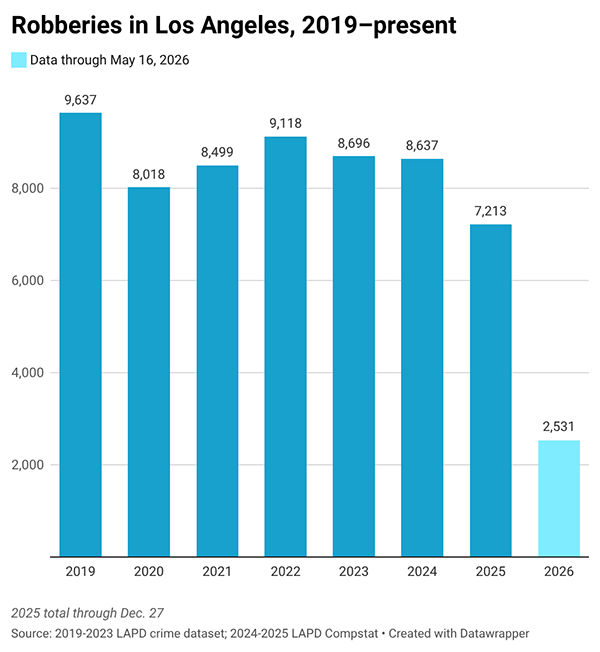
Robberies
Robberies are also below pre-COVID levels, down 25% last year compared with 2019. Because of the way Compstat aggregates data, it’s not clear how many of those incidents involved firearms. Numbers this year are also trending down.
How we did it: We analyzed reports from Open Data through 2024 as well as recent Compstat reports.
Have questions about our data? Write to us at askus@xtown.la


