Election surprise—voter turnout spikes in the city of Los Angeles



Since the June 2 election, Los Angeles, and the rest of California, have been slammed with complaints that the slow vote-counting process meant something nefarious was happening. The allegations are unfounded, as for years, later votes have broken toward Democrats and progressive candidates.
Those assertions overshadow something dramatic that happened in the election: Turnout in the city of Los Angeles soared compared to past primaries.
In the city, 867,677 people cast a ballot on June 2, according to vote statements provided by the L.A. County Registrar-Recorder/County Clerk. That is 205,000 more people than voted in the June 2022 primary, or a 31% increase.
This runs counter to much of the pre-election predictions, as there were concerns that the lack of “exciting” candidates in the governor and mayor races would tamp down participation. But turnout in the city stands at 39.03% (the figure could tick slightly higher once the election is certified).
This chart shows citywide turnout in the last three elections when a mayoral primary took place—that means this year, 2022 and 2017.

Yes, in the March 2017 primary, when the biggest city draw was Mayor Eric Garcetti seeking a second term against token opposition, a meager 21.27% of Angelenos bothered to vote, and the 413,896 people who cast a ballot was less than half the count this year. Ongoing abysmal turnout was part of why the city in 2020 shifted elections from odd- to even-numbered years, and aligned the schedules with state and federal election cycles.
Also a countywide climb
Mayor Karen Bass finished first in the mayor’s race, just as she did in the 2022 primary, when businessman Rick Caruso outspent her by a 15-to-1 margin.
This month, Bass earned more than 292,000 votes, and will face Councilmember Nithya Raman in the November general election.
The person in the city who got the most votes was incumbent Controller Kenneth Mejia, with more than 472,000. That is nearly double the 240,374 votes he received in the 2022 primary.
The city was not alone in seeing a participation bounce this year. L.A. County numbers were also up over those in recent primary elections.
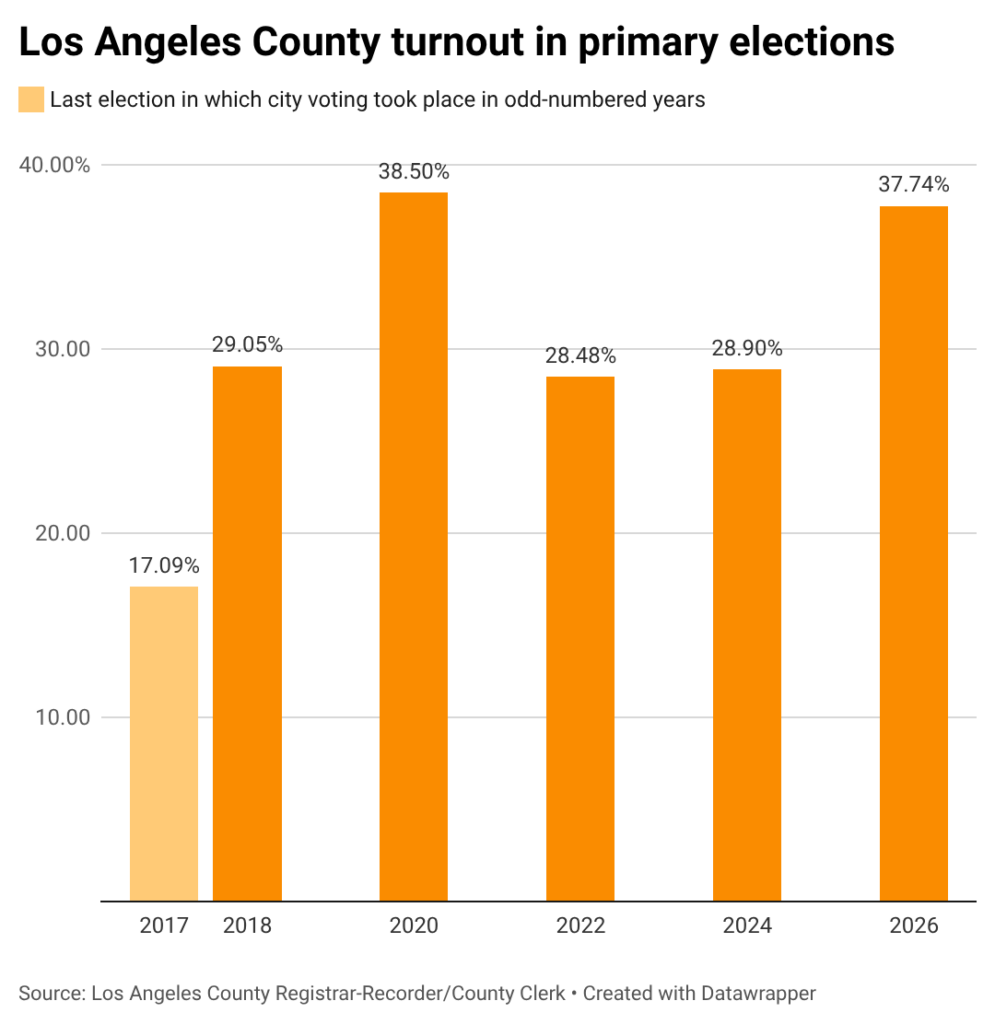
It’s worth noting that there are some differences. The March 2017 countywide figure was primarily driven by elections in individual cities, from Los Angeles to Azusa, and the sole countywide item was a sales tax. The lack of a major regional or state race kept turnout down. Comparatively, elections in 2018, 2022 and this year included a gubernatorial primary, while 2020 and 2024 held a presidential primary.
Still, this year’s turnout, perhaps because of the opportunity to choose a new governor, is the highest in L.A. County since 2020.
More than 2.22 million county residents cast a ballot this month, according to Registrar-Recorder/County Clerk results. Of that, 81.77% were by mail.
Turnout up, but uneven
While turnout in the city of Los Angeles surpassed previous years, participation varies wildly depending on council district. Not surprisingly, affluent areas on the Westside and in the San Fernando Valley send far more people to the polls than do lower-income communities in South L.A.
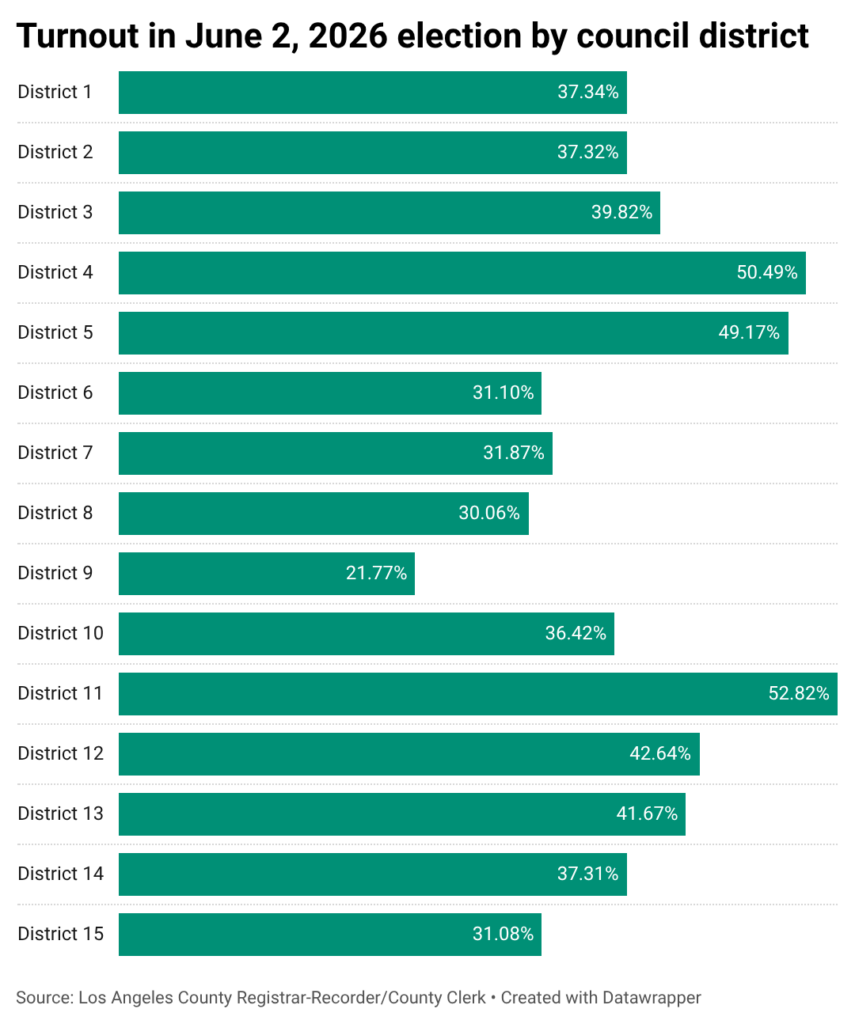
Turnout in the eight odd-numbered districts where a council election was happening this year all exceeded the count in 2022. Additionally, voter participation across the board often doubled, tripled or even quadrupled the count from 2017.
For example, check out the change in the West Valley’s Council District 3, which includes Woodland Hills, Winnetka, Reseda and other other neighborhoods.

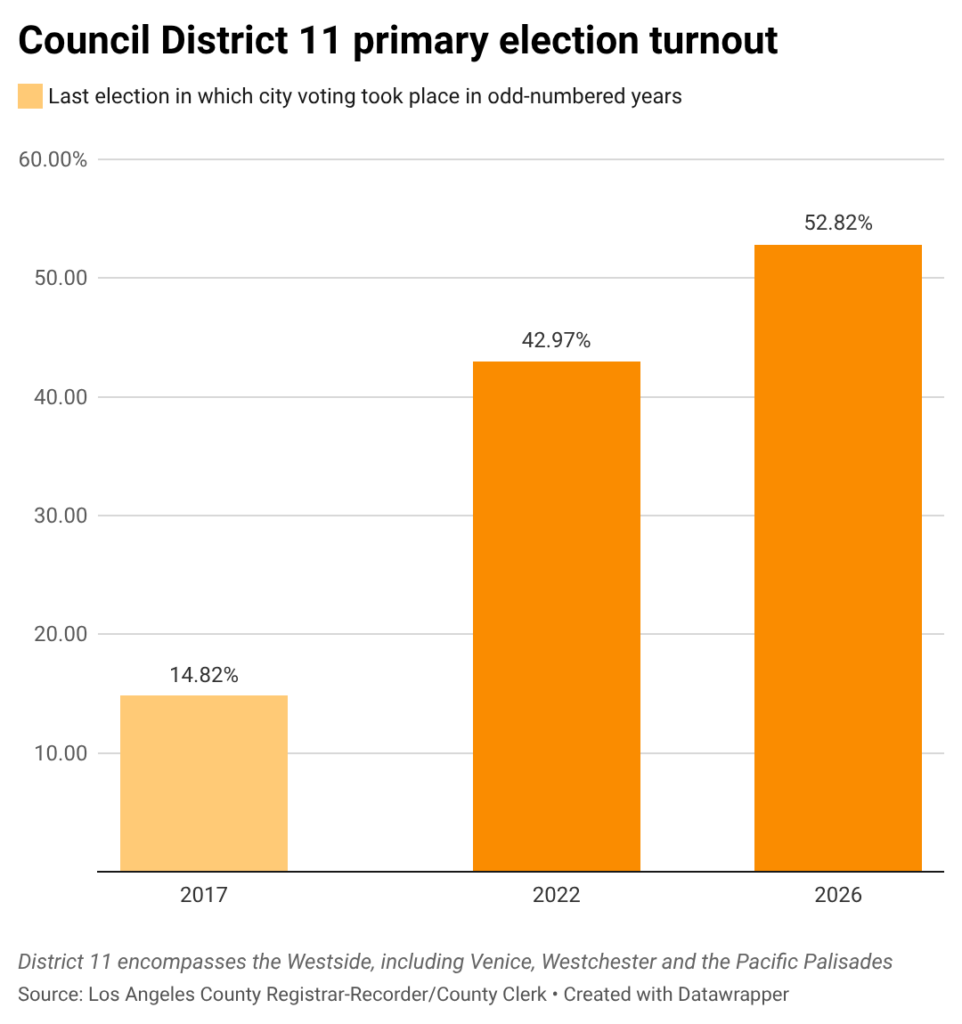
Another dramatic rise occurred in District 11. The Westside territory, which includes Venice and Westchester, among other areas, recorded the highest vote total and highest turnout rate of any council district. Many residents were likely drawn by a fierce City Council contest (incumbent Traci Park crushed her opponent).
One potential additional bright spot: General elections routinely bring much higher turnout than the primary. So even more people might be participating in November. Yes, we’re already talking about the November election.
How we did it: We examined publicly available voter data provided by the Los Angeles County Registrar-Recorder County Clerk, and the Los Angeles City Clerk’s election archives.
Have questions about our data? Write to us at askus@xtown.la.