Is Los Angeles Experiencing a Crime Bump?
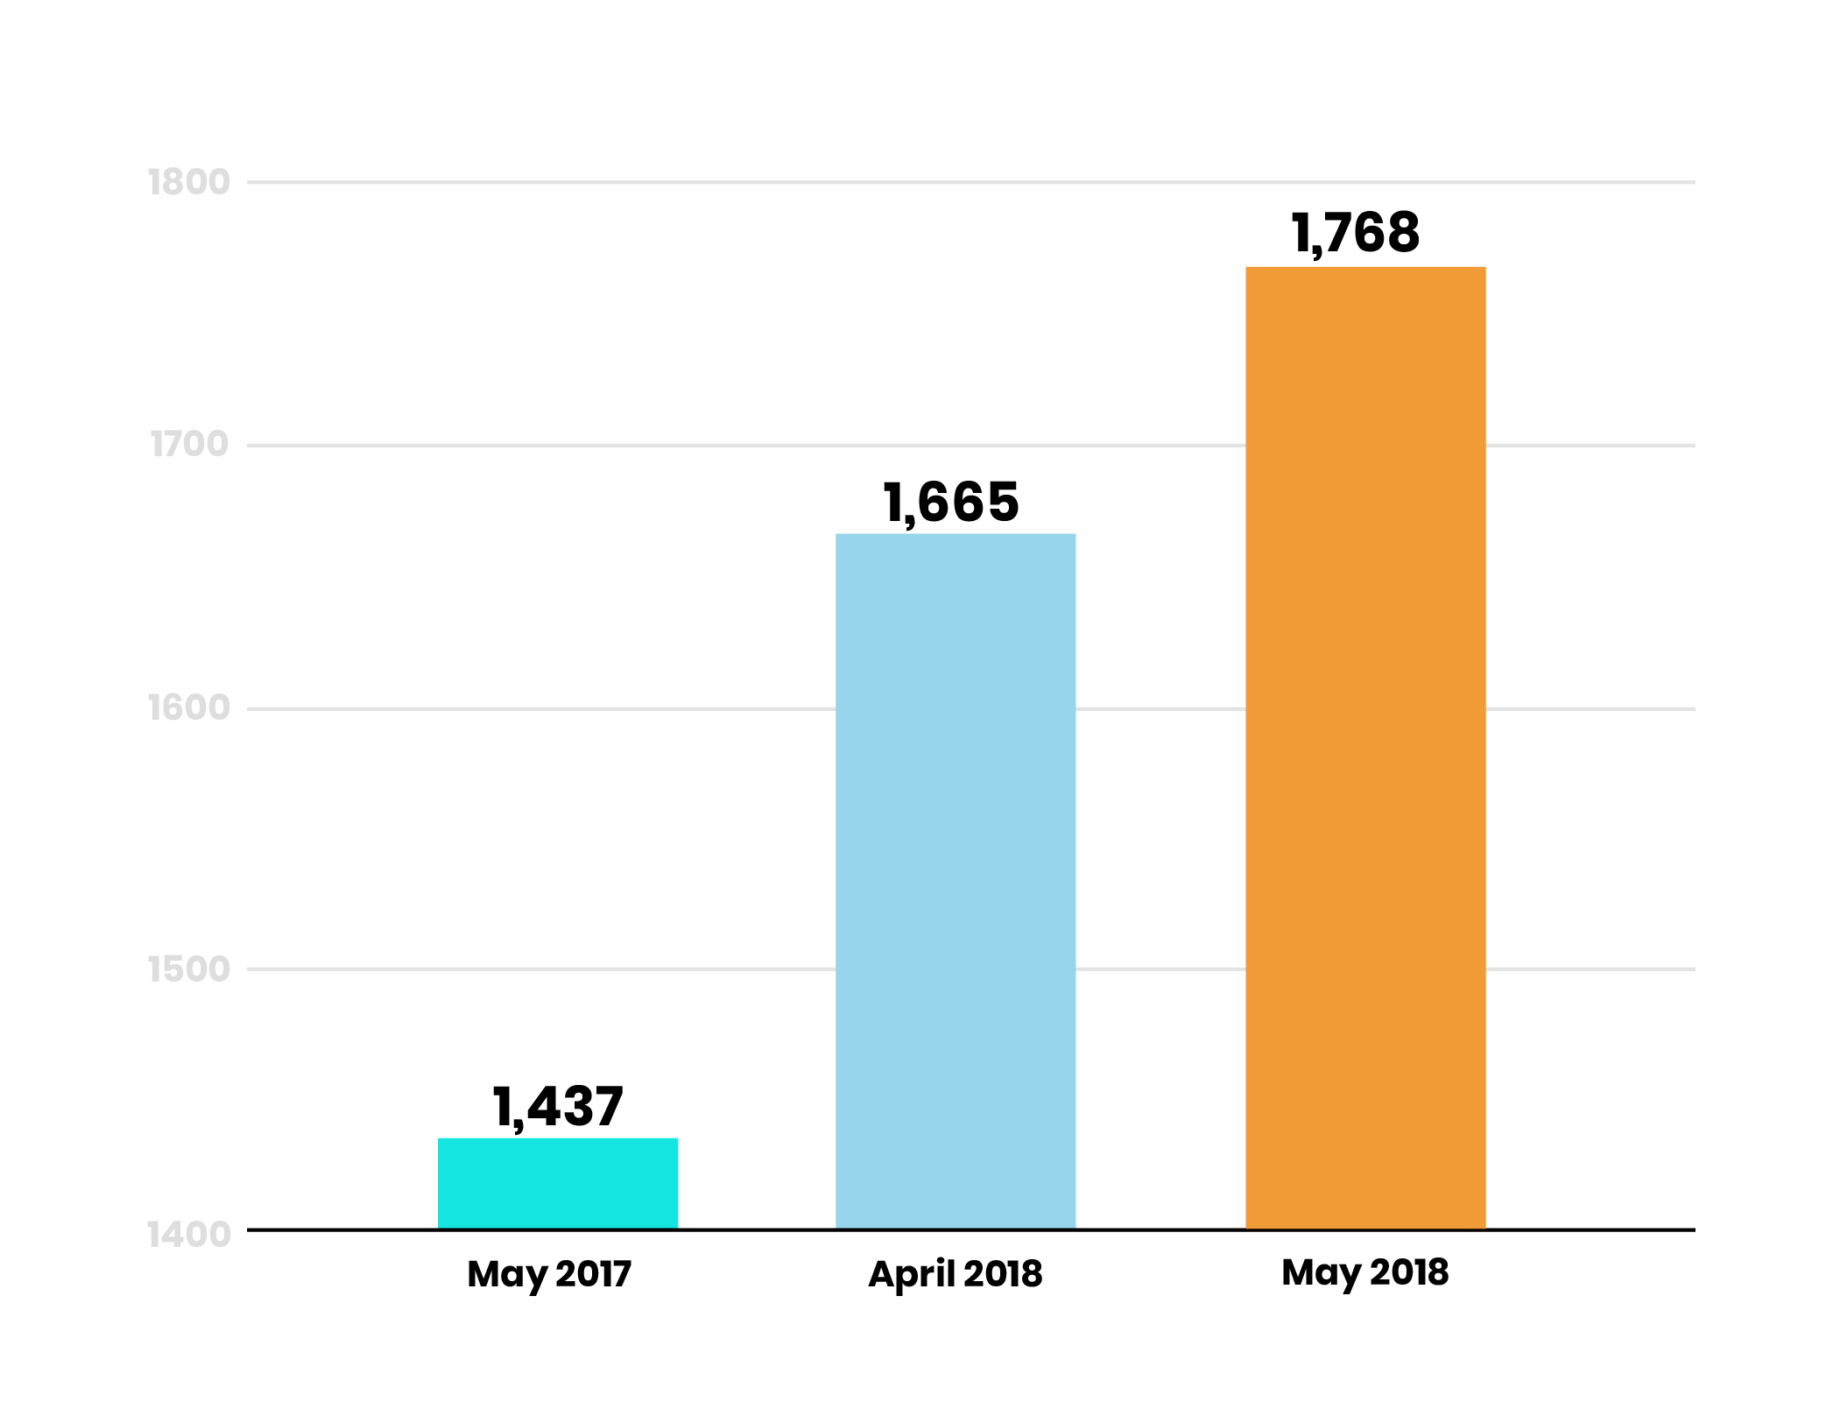
Among the top 10 most common crimes committed in Los Angeles this May, nine of them rose from last month and also from the same month a year ago.
The sharpest rise?
Assaults* in Los Angeles jumped 23.0% from May of 2017. It was also the most common crime in May.
*Does not include aggravated assault.

Downtown LA had the most assaults, with 174.
This number rose from 154 in April and 119 a year ago.
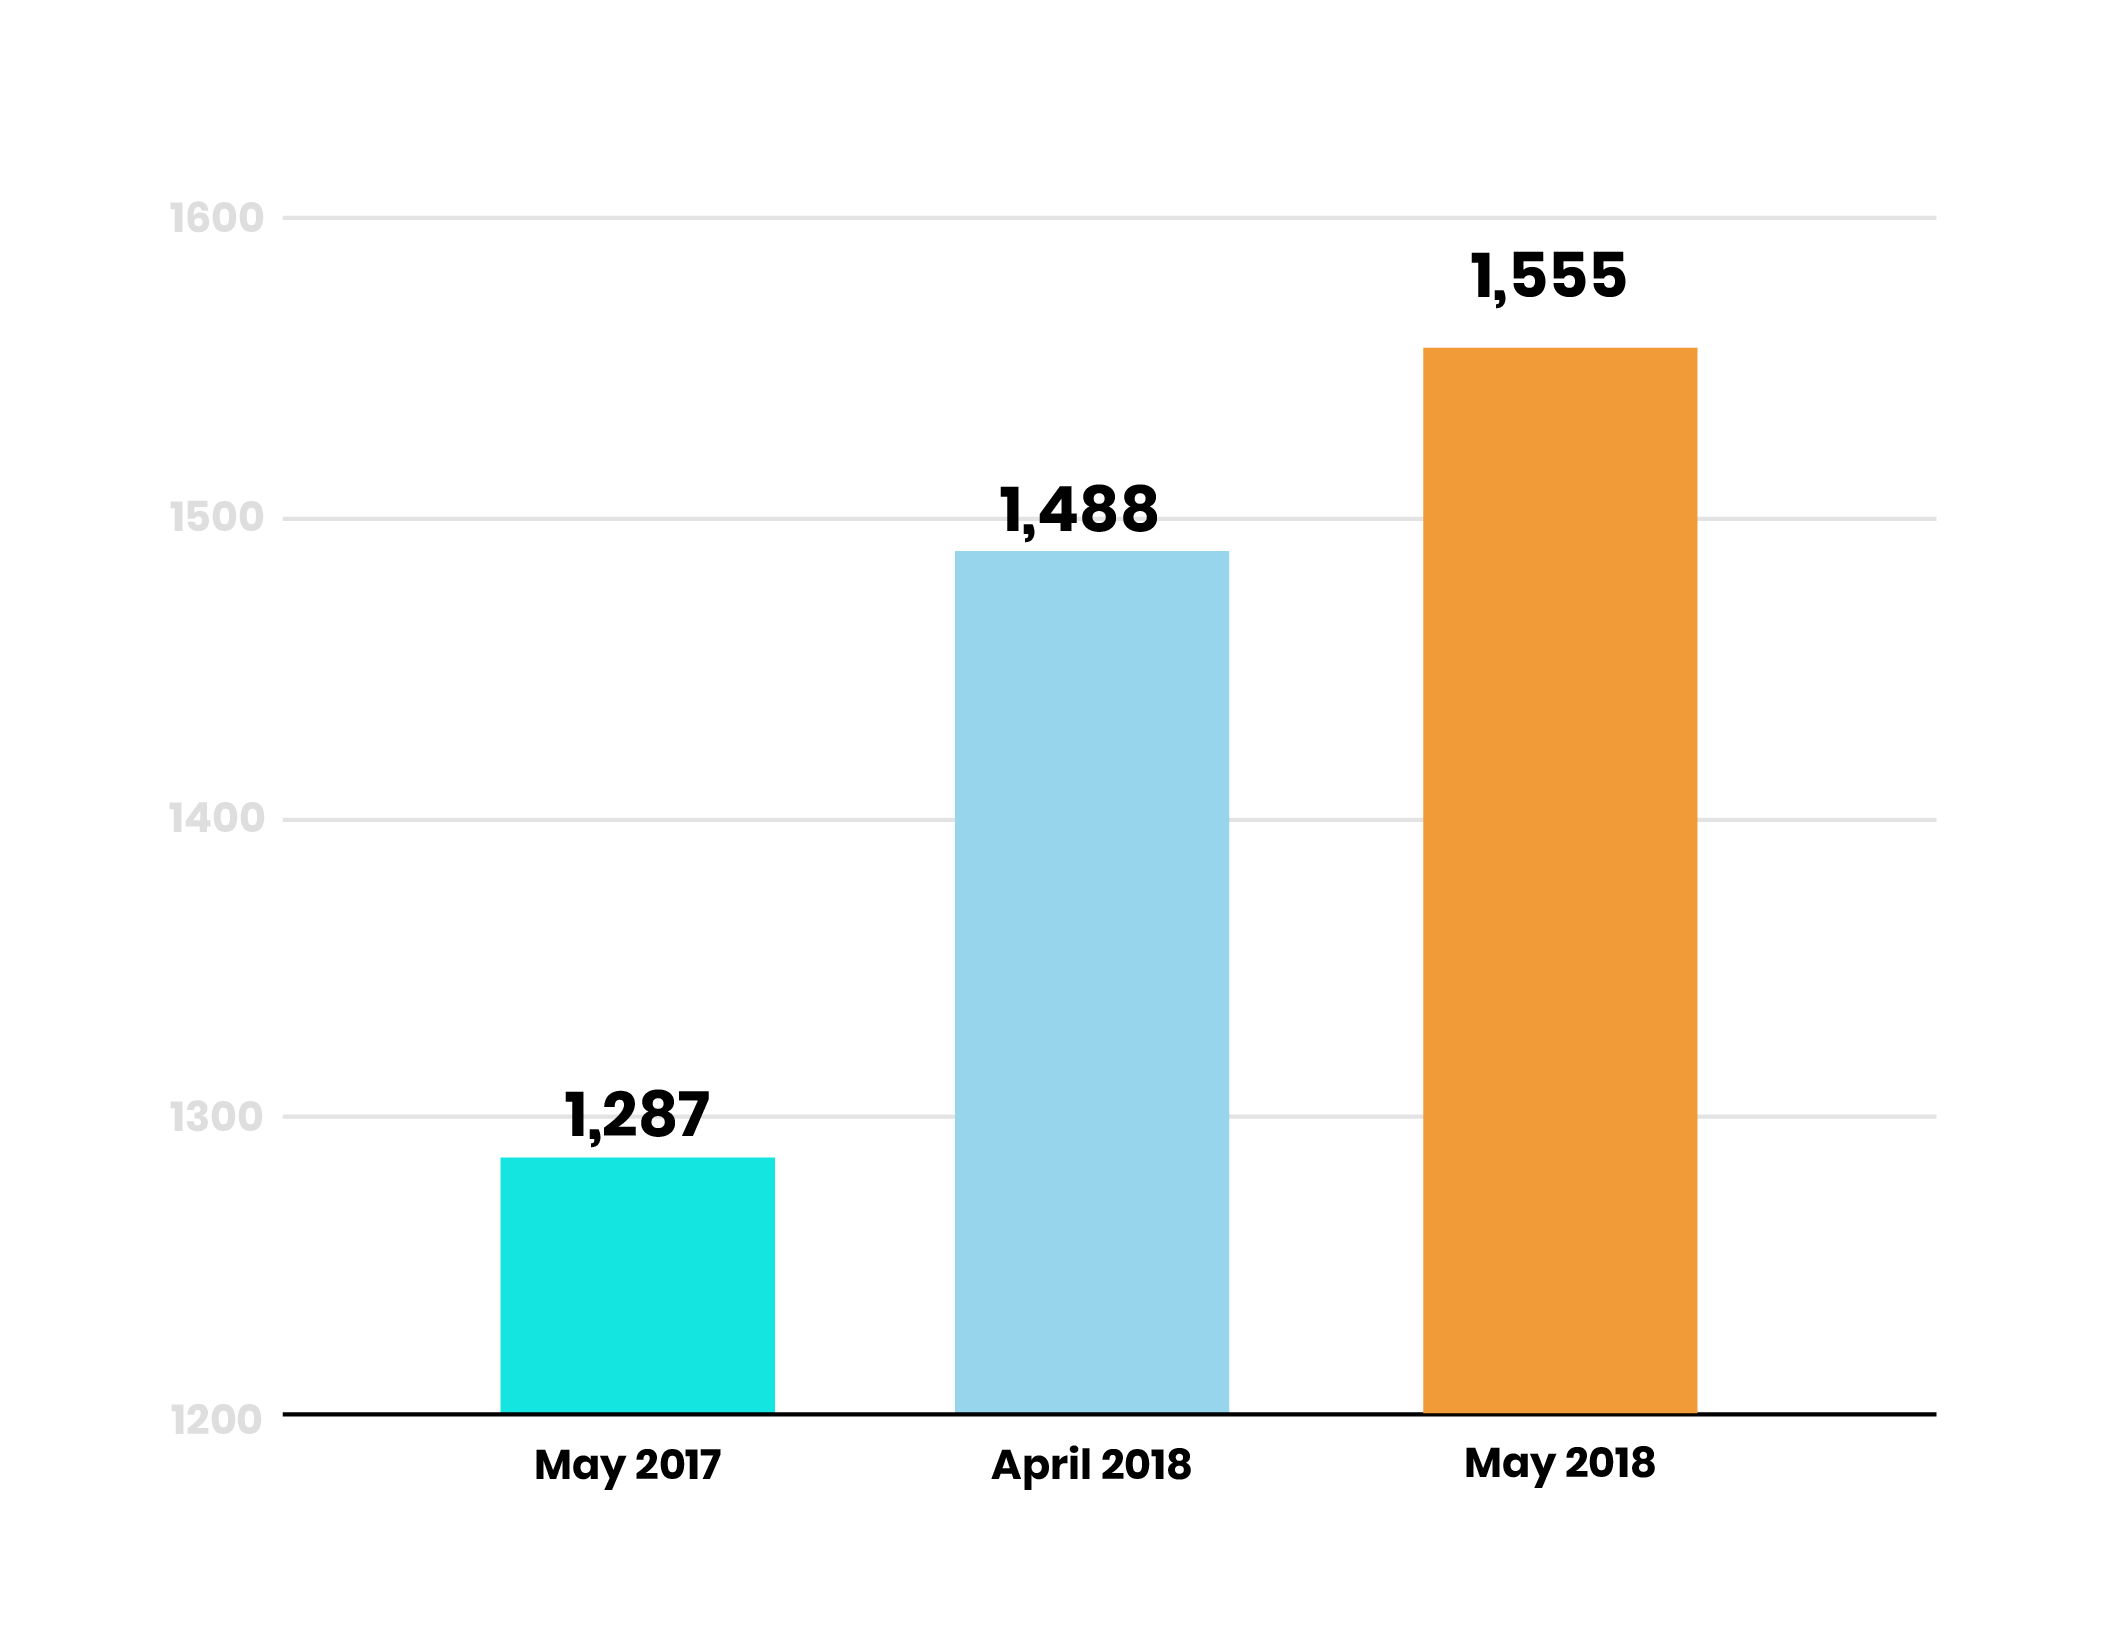
The second-most common crime was theft from a vehicle. There were 1555 in May, a 20.8% increase from May 2017.

Again, Downtown LA tops the list, with 143 in May 2018, a 62.5% increase from last year.
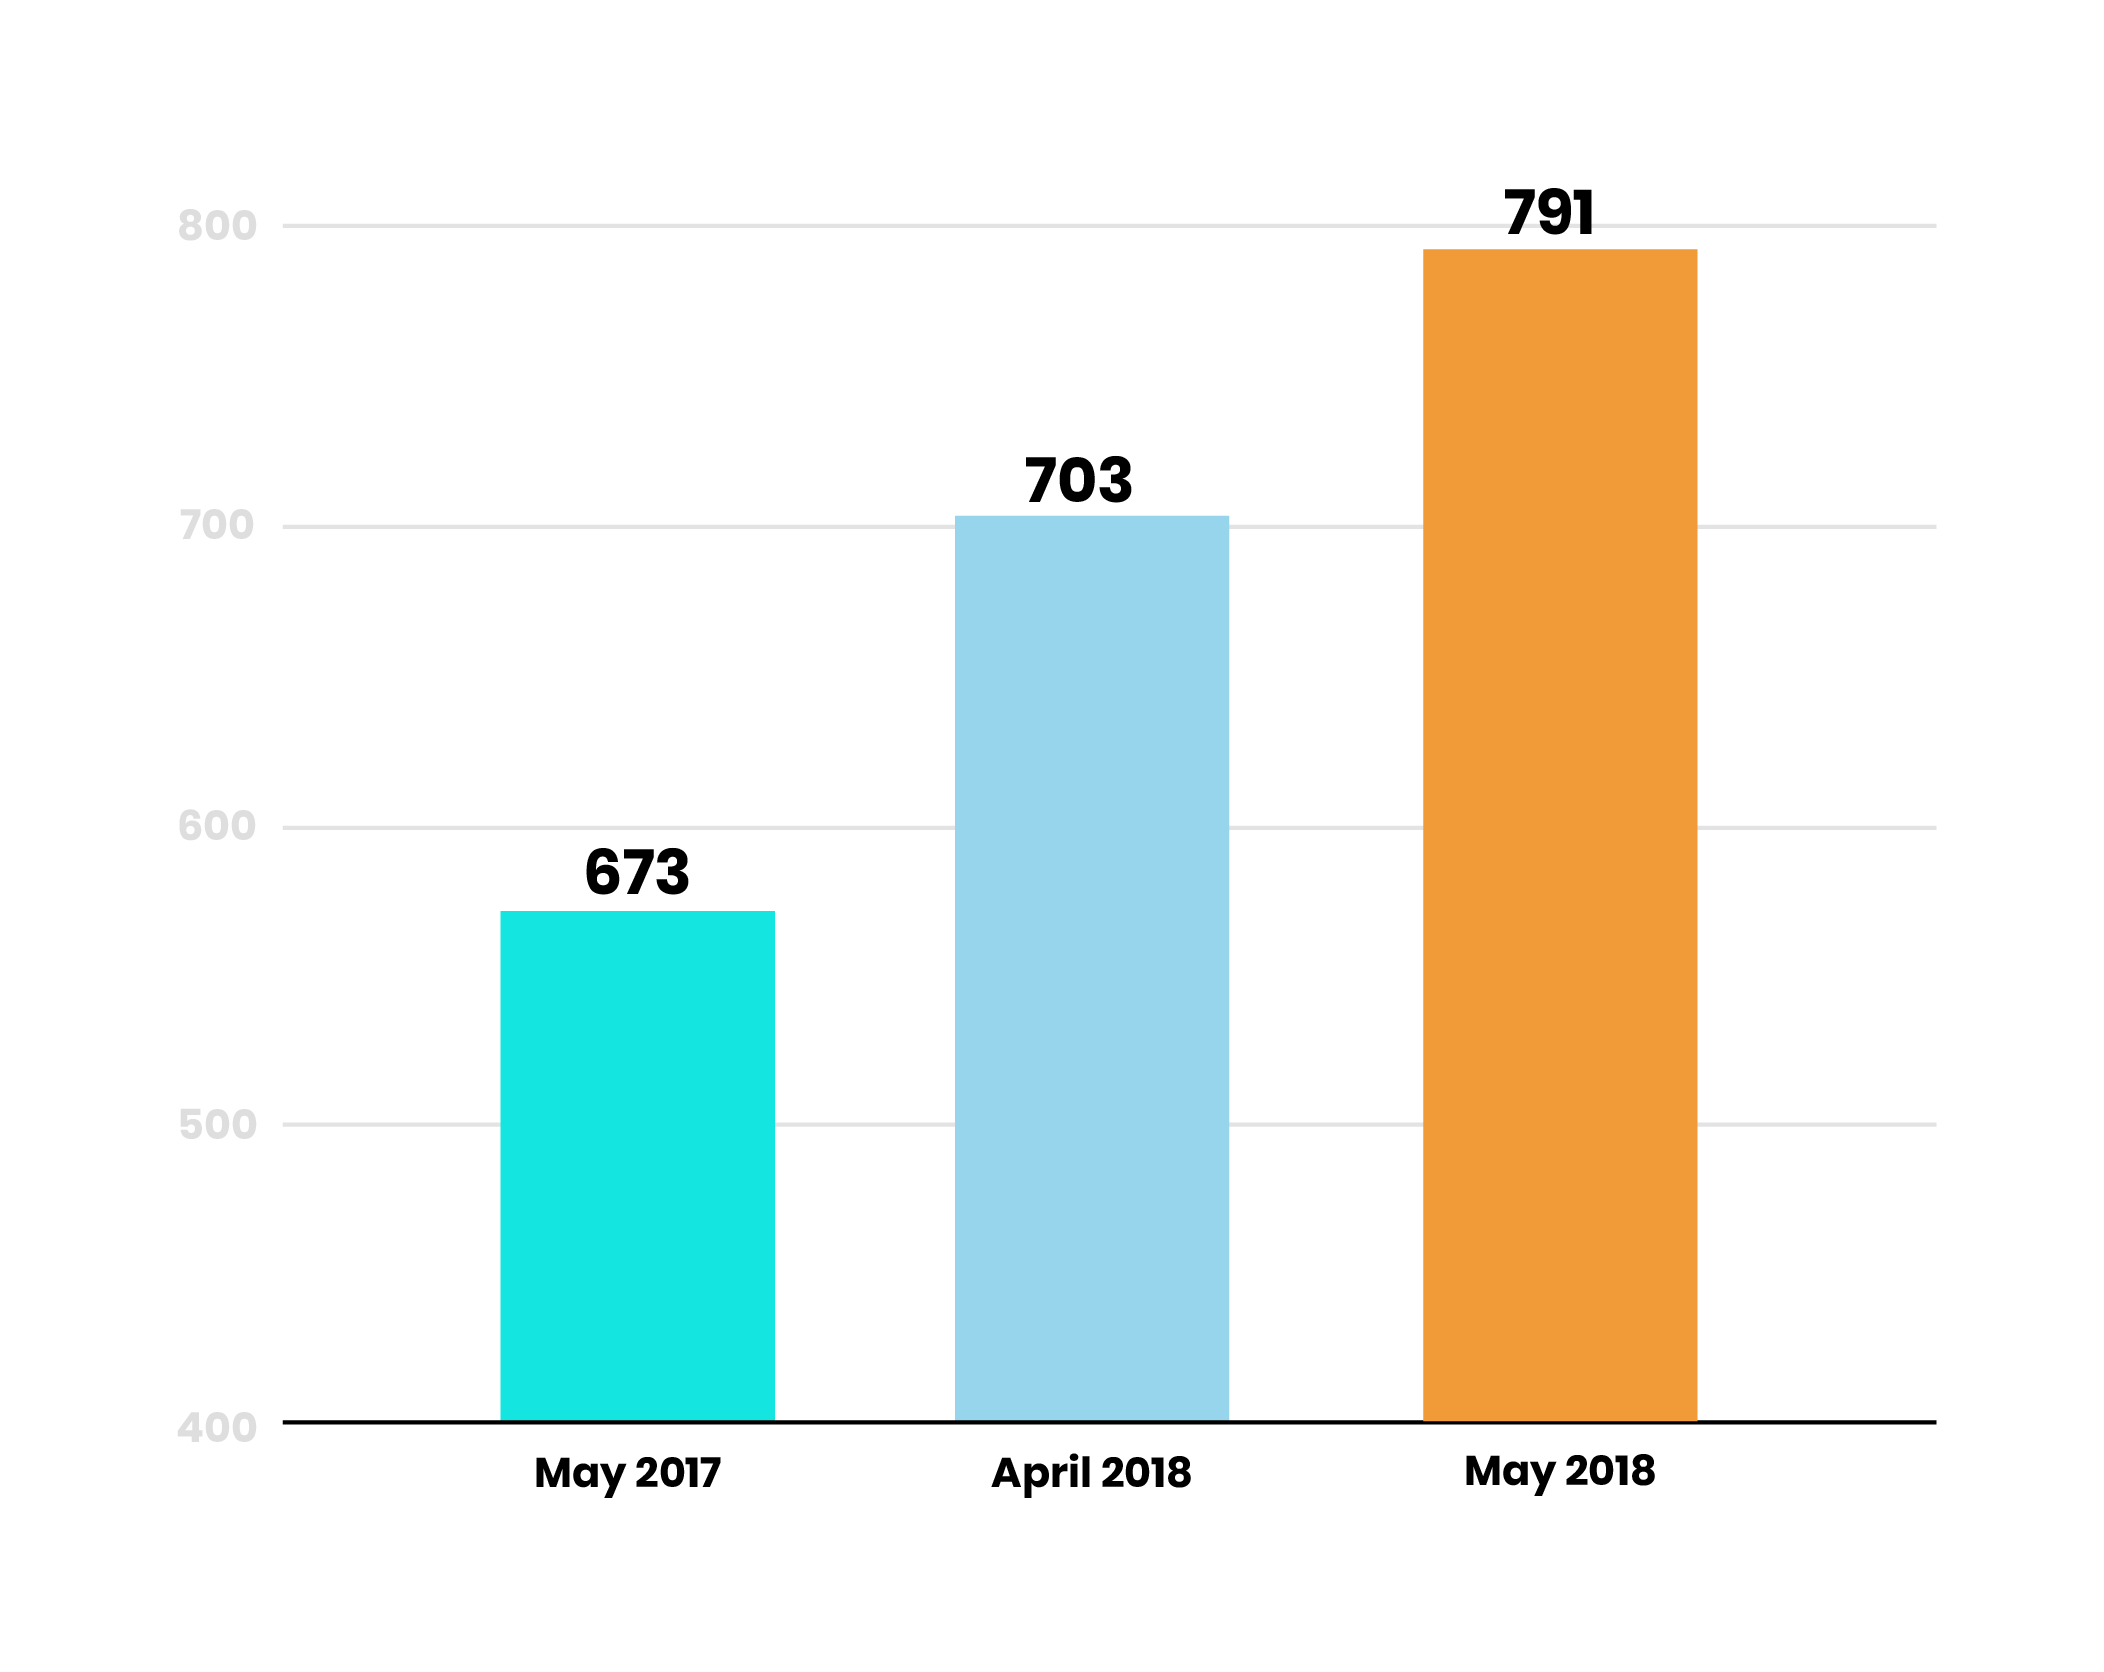
Misdemeanor vandalism had a 12.52% increase from April and 17.53% increase from same period last year.

| Crime | May 2018 | April 2018 | Percentage Change | May 2017 | Percentage Change |
|---|---|---|---|---|---|
| Assault | 1768 | 1665 | 6.19% | 1437 | 23.03% |
| Theft from Vehicle | 1555 | 1488 | 4.50% | 1287 | 20.82% |
| Vehicle Theft | 1503 | 1461 | 2.87% | 1496 | 0.47% |
| Petty Theft | 1226 | 1165 | 5.24% | 1159 | 5.78% |
| Burglary | 1224 | 1166 | 4.97% | 1214 | 0.82% |
| Domestic Violence | 1075 | 1049 | 2.48% | 1045 | 2.87% |
| Aggravated Assault | 935 | 846 | 10.52% | 865 | 8.09% |
| Petty Theft from Motor Vehicle | 877 | 871 | 0.69% | 856 | 2.45% |
| Misdemeanor Vandalism | 791 | 703 | 12.52% | 673 | 17.53% |
| Felony Vandalism | 778 | 1030 | -24.47% | 1014 | -23.27% |
| Total number in LA city | 18882 | 18301 | 3.17% | 18188 | 3.82% |
Have questions about our data? Or write us at askus@xtown.la


