

LA in slo-mo


In case you’ve lost all sense of time, Los Angeles is entering its fourth week since Mayor Garcetti issued his “safer at home” order, closing all but essential businesses.
We have been charting how the precautions to slow the spread of COVID-19 have impacted life in LA. While we can’t track whether or not you’ve changed out of your pajamas or how much Nutella you might have eaten, we can track how crime and gas prices have fallen. Here’s what the data tell us about the slowdown:
Fewer fender benders
Less traffic means fewer collisions. The number of car crashes is now a mere fraction of what it was a year ago. In 2019, the City of Los Angeles counted an average of 155 collisions a day. While at the beginning of the month that trend largely continued, that would soon change.
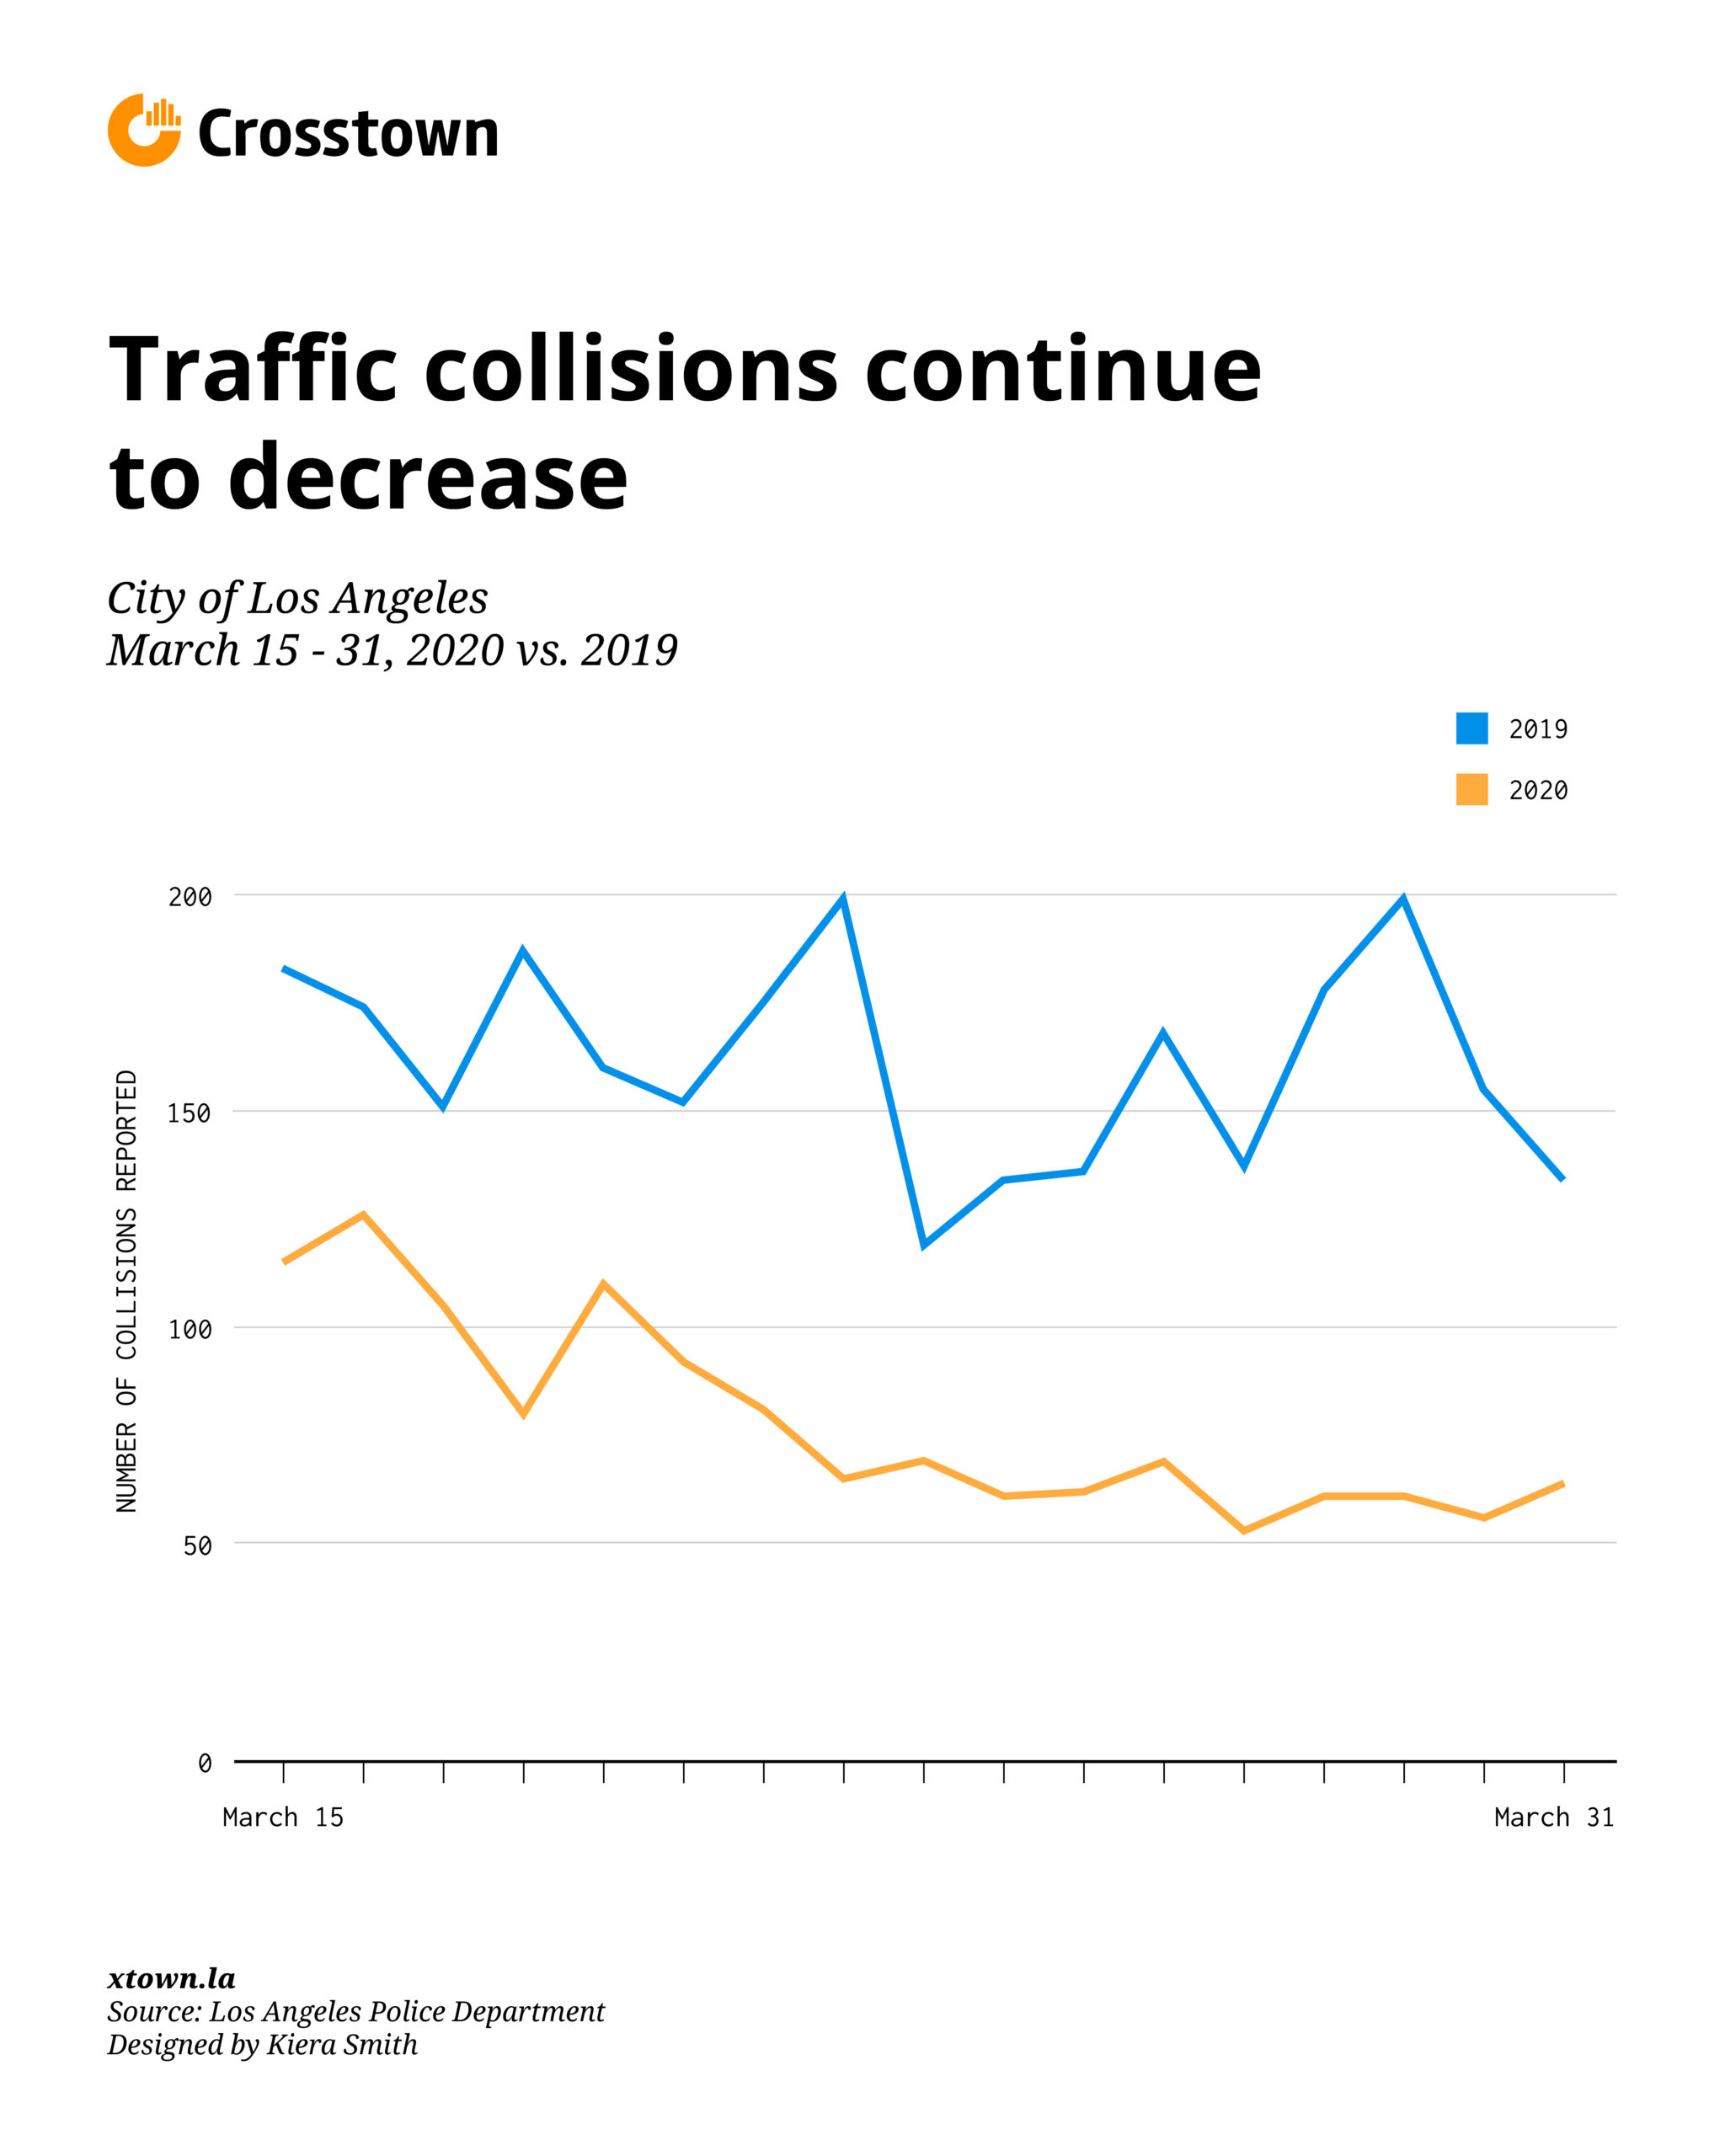
From March 15, 2020 – March 31, 2020 –– the most recent day for which accurate data is available –– that number fell even further, to only 78 a day.
That does not mean roads are completely safe, however. As freeway speeds have shot up, law enforcement has warned that crashes can be much more dangerous as a result.
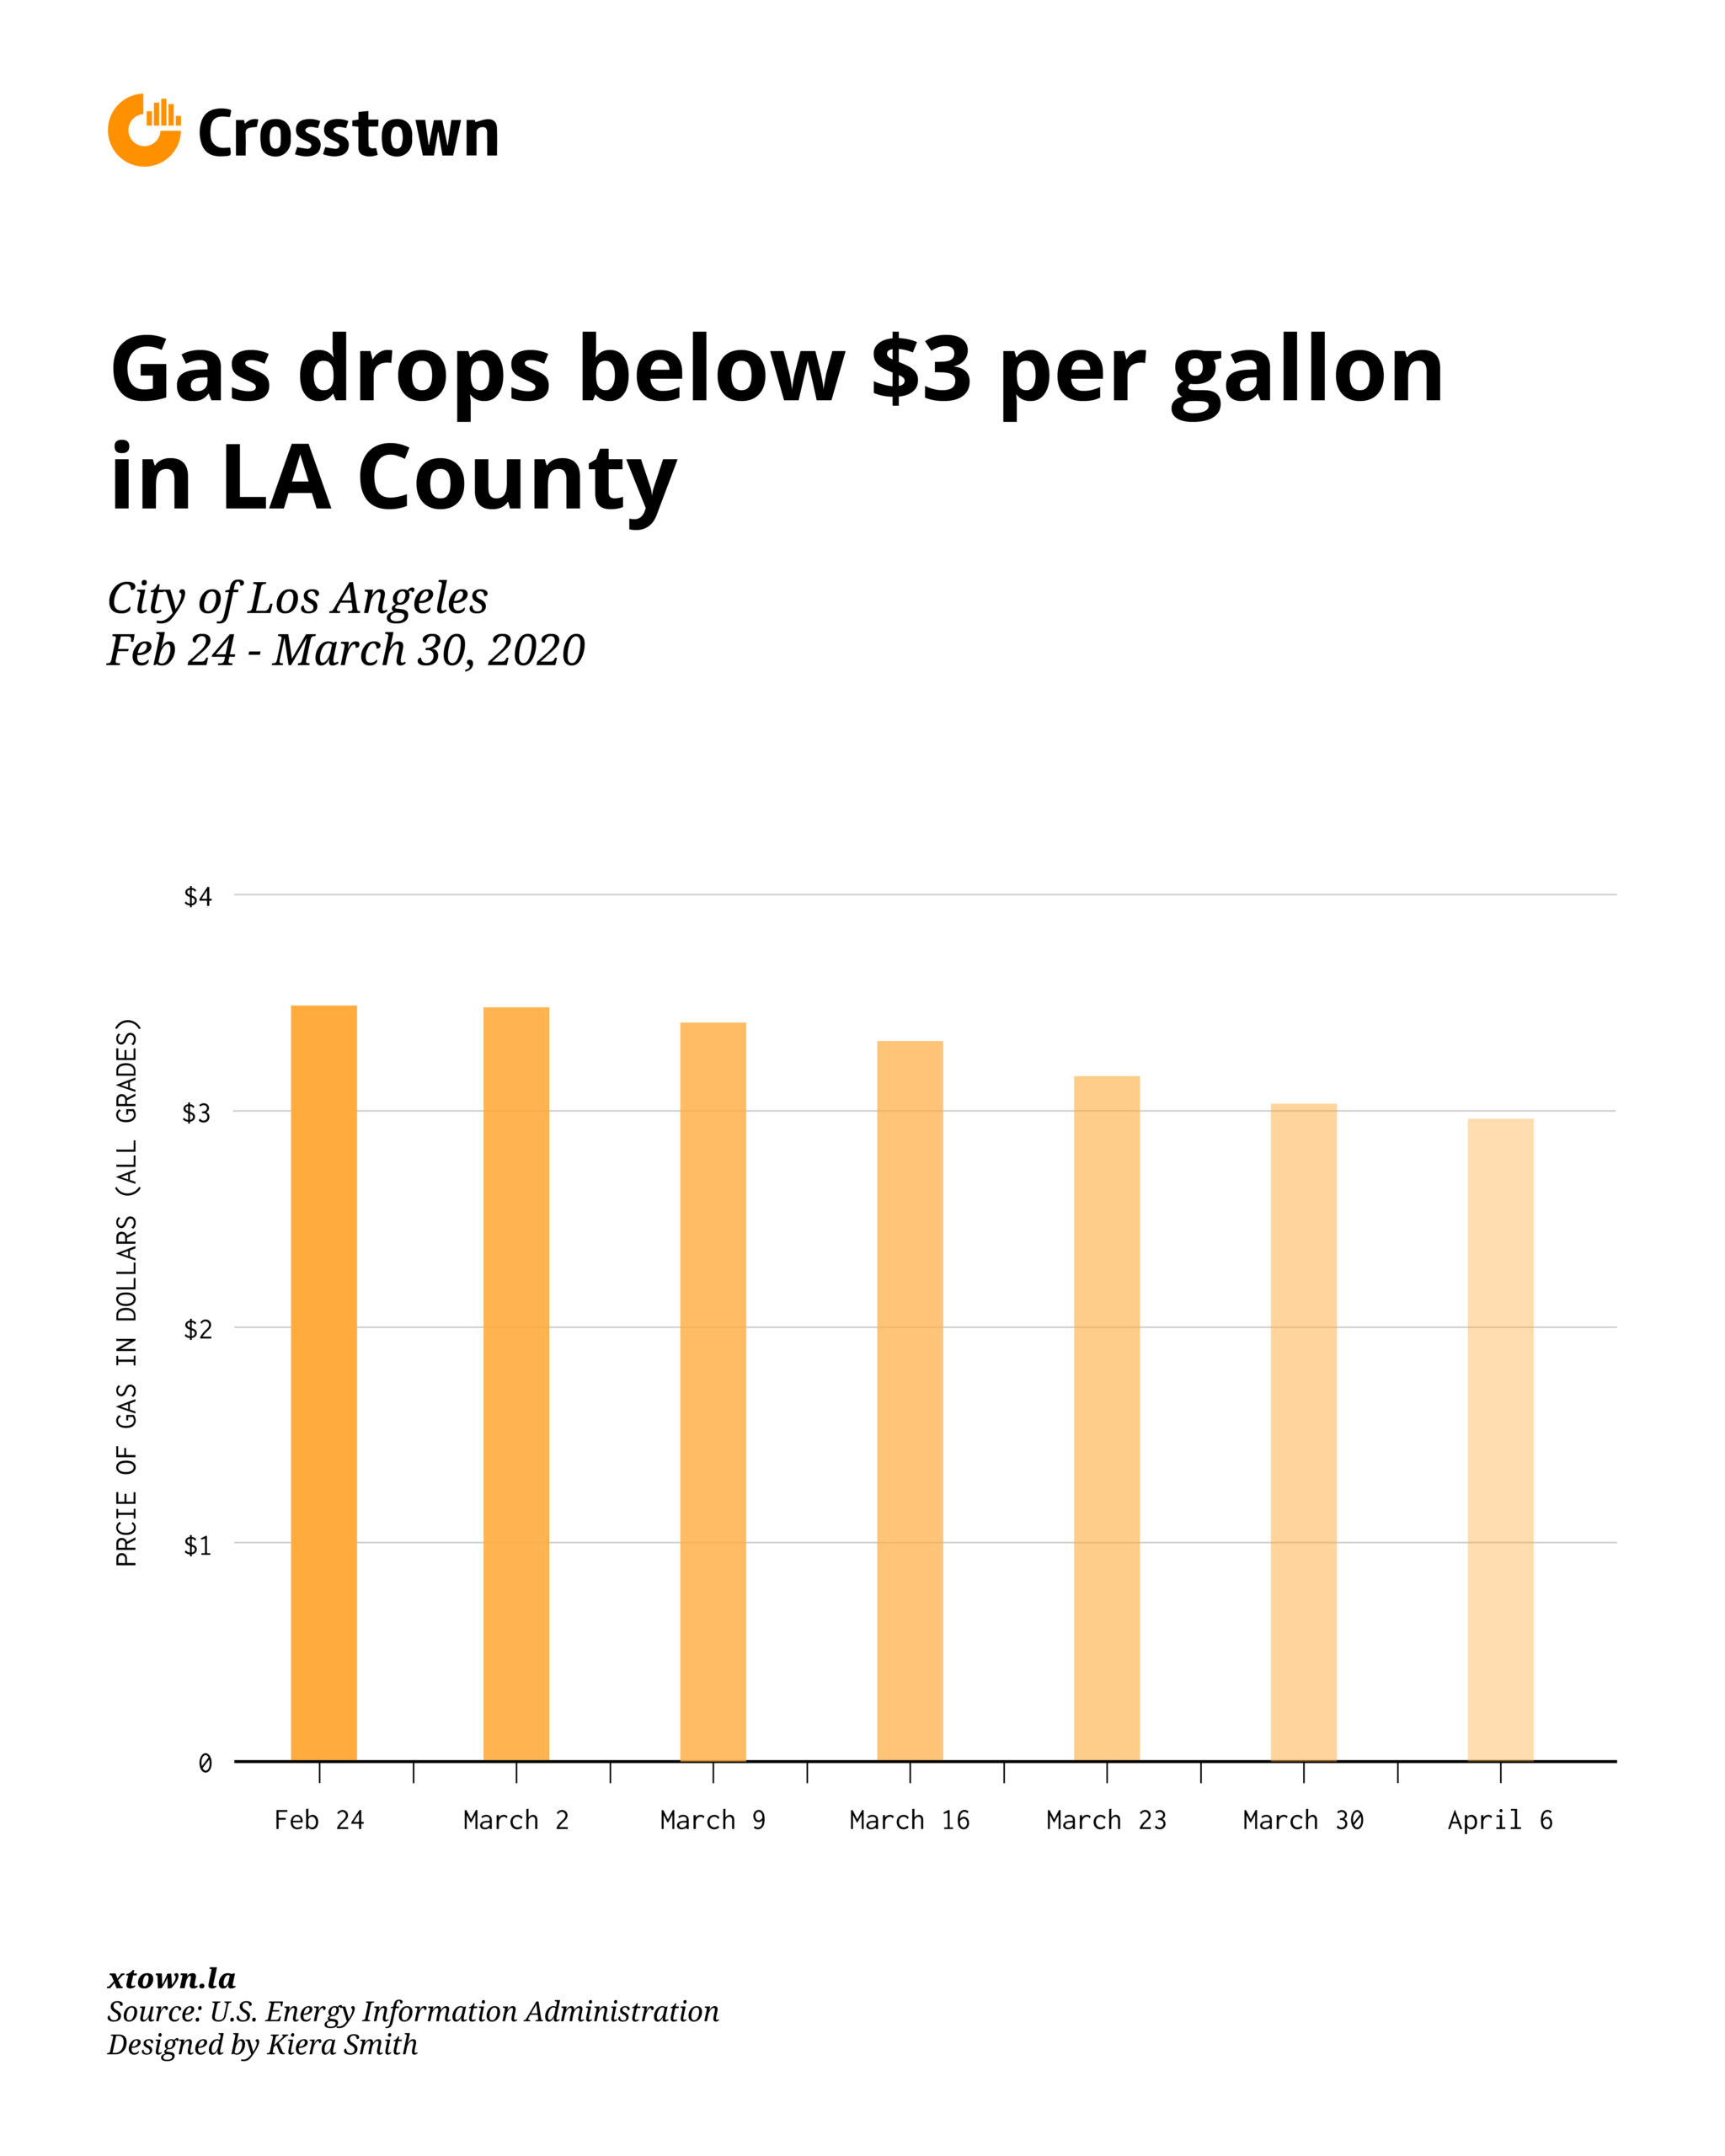
Gas prices tank
Now might be the time to fill up your tank, because gas prices in LA have dropped below $3 a gallon. According to the U.S. Energy Information Administration, this is the lowest gas prices have been in LA County since July 2017.
Crime in Los Angeles
It’s tough to rob a house when everyone is stuck at home. Crime began to fall as soon as the first restrictions were put in place. But in recent days, the drop has become even steeper. With people sheltering at home, the last two weeks of March registered a 41% drop in reported crime compared with the same period last year. After California’s safer at home order was issued on March 19, average daily crime reports dropped to 358 on March 30, from 494 10 days earlier.

Arrested Development
As with crime, arrests also declined during the latter half of March. Although at the time of publication, no arrest data was available after March 28, there was a clear drop-off in arrests in the latter half of the month, especially as compared to March 2019.

How we did it: We examined publicly available LAPD data, arrest and traffic data, as well as county-wide data on gas prices. For gas prices, we used data from the U.S. Energy Information Administration. Learn more about our data here.
LAPD data only reflects crimes that are reported to the department, not how many crimes actually occurred. In making our calculations, we rely on data the agencies make publicly available.
The LAPD does periodically update past crime reports with new information, which sometimes leads them to recategorize past reports. Those revised reports do not always automatically become part of the public database. We try to update our reporting when new data becomes available.
Want to know how your neighborhood is faring? Or simply just interested in our data? Email us at askus@xtown.la.


