

Traffic on the weekend? No, not yet


When Los Angeles went into COVID-19 shutdown mode almost three months ago, weekend traffic took a major dive – and it hasn’t come back yet.
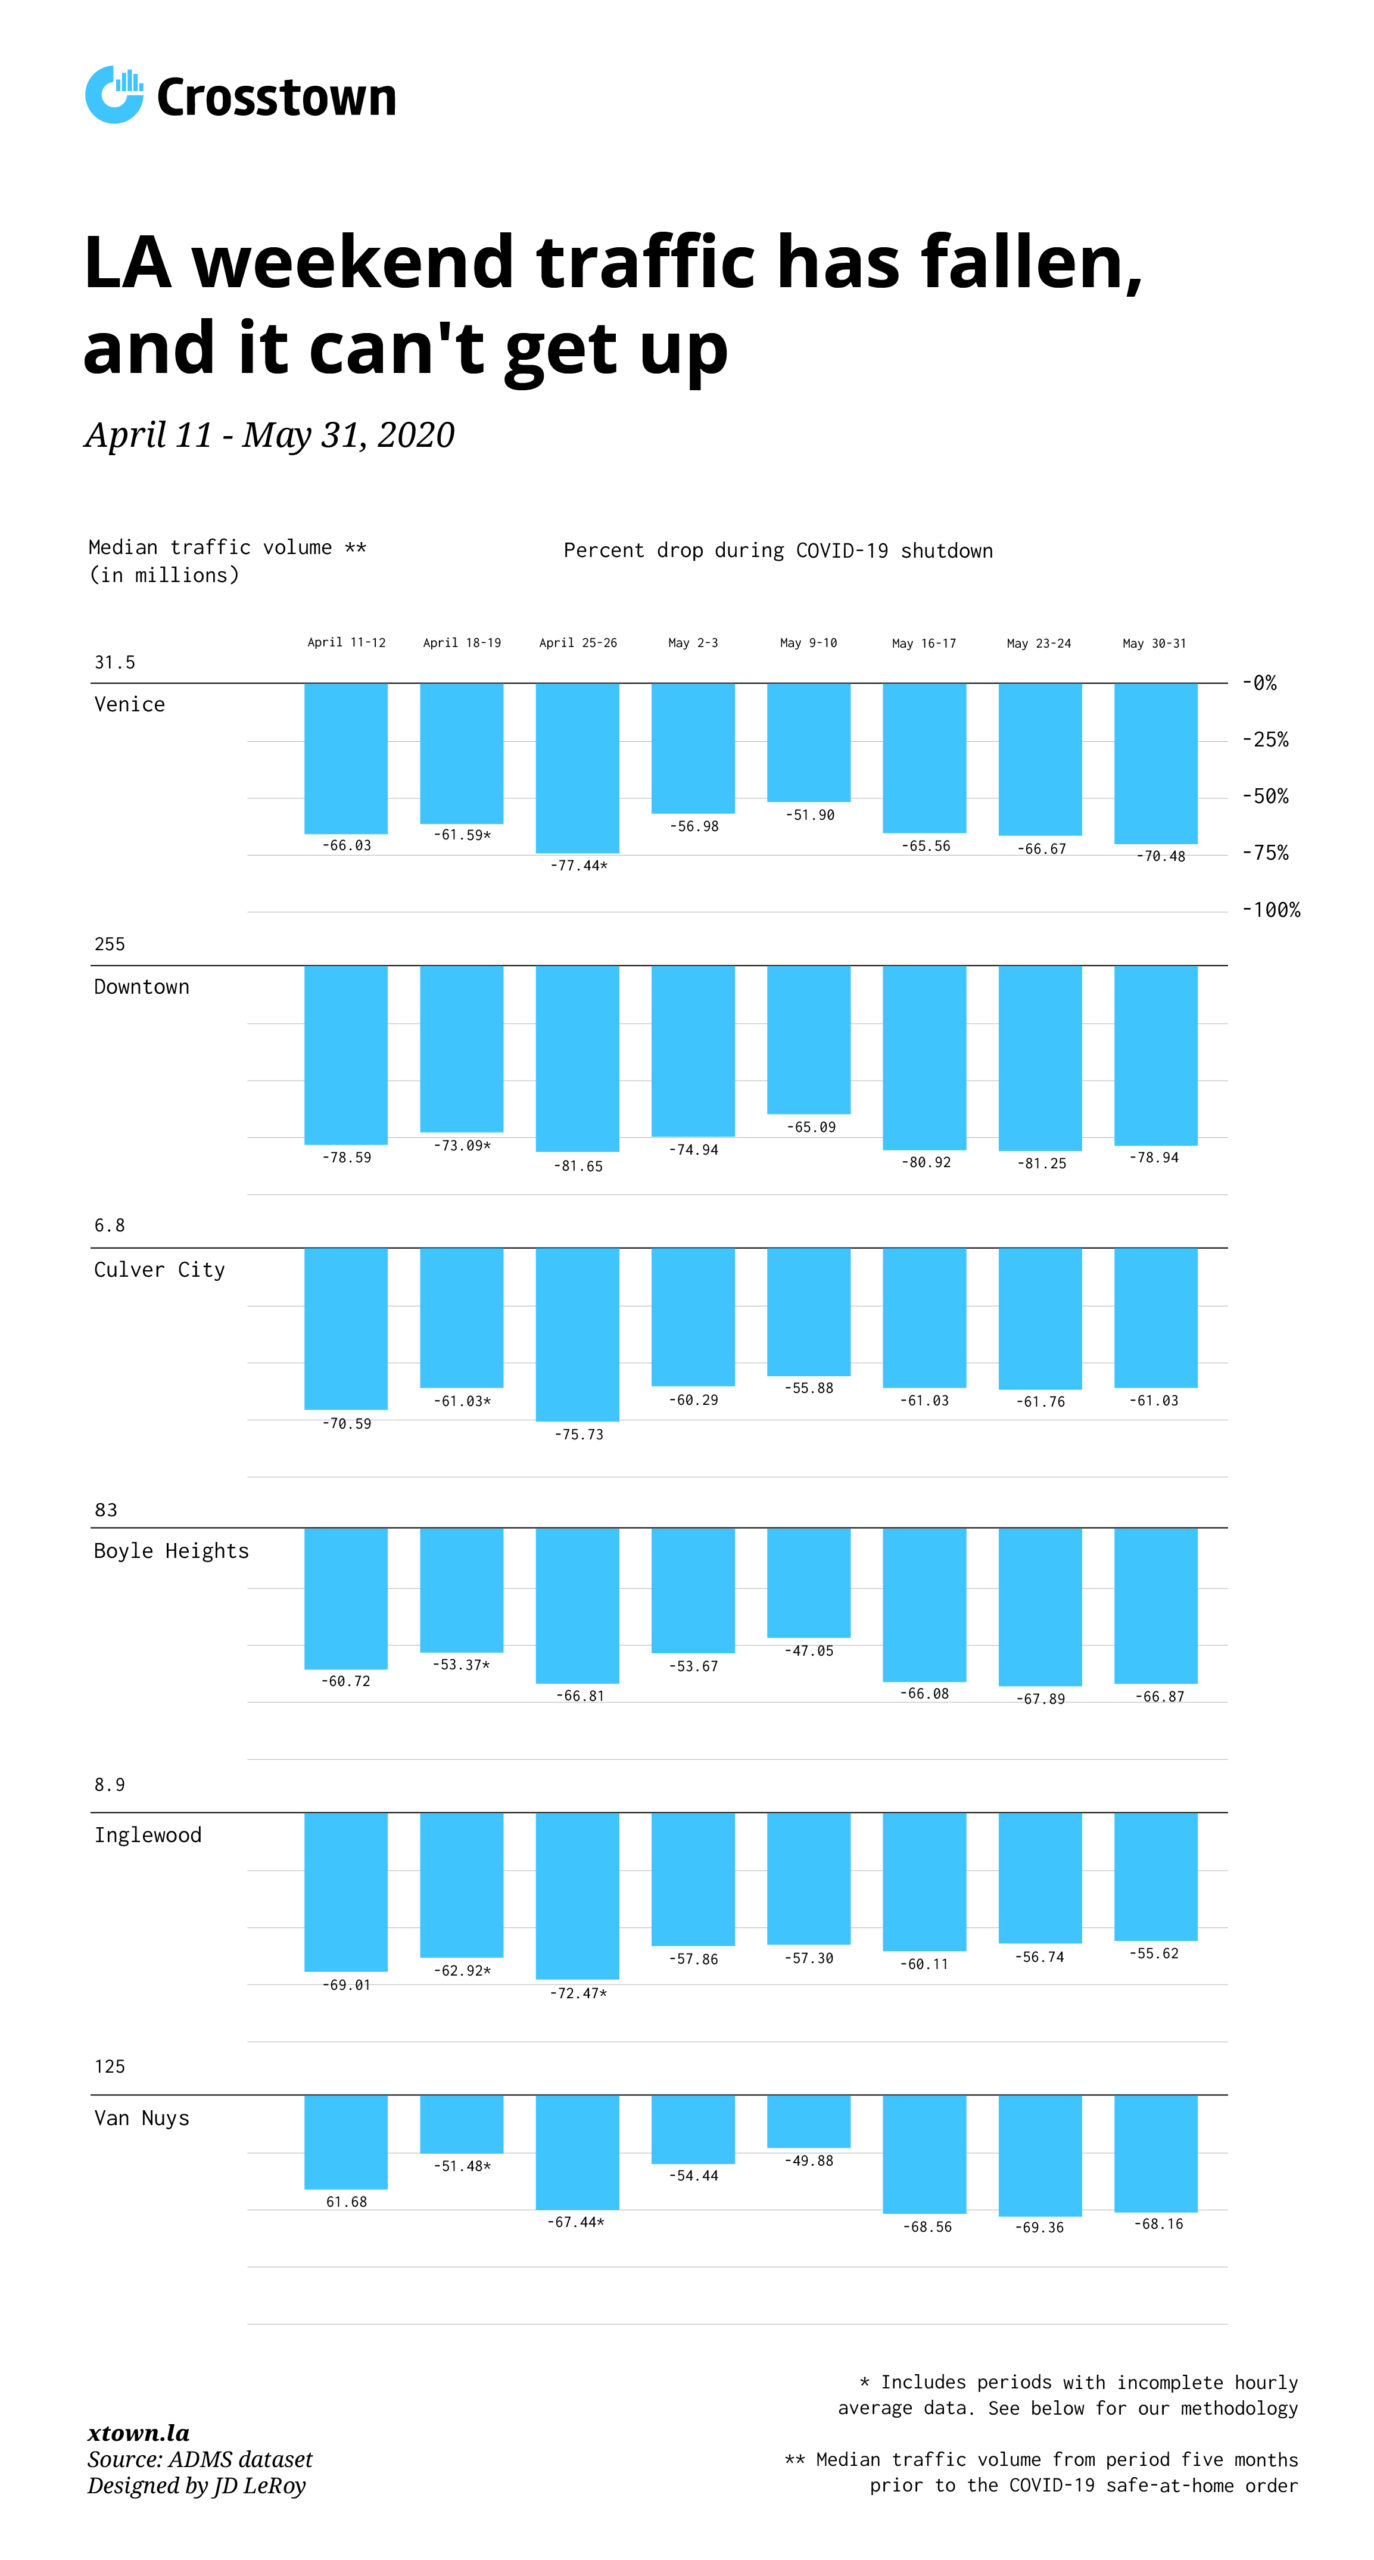
The data on weekend car volume indicates that even during the weekend of May 30-31, which saw numerous protests against the killing of George Floyd, an unarmed black man, at the hands of Minneapolis police, Angelenos are generally not getting in their cars.
Schools and universities have shuttered their doors for the summer, and although limited in-person dining is now permitted in Los Angeles County, most restaurants are sticking to take-out for now.
This has turned once busy streets into bike-friendly areas. Eli Akira Kaufman, executive director of the Los Angeles County Bicycle Coalition, has noticed more people trading in four wheels for two.
Breathing room for bikes
“I’ve seen a lot less volume on the weekdays and weekends, although it’s gradually increasing again,” he said. “In late March and early April, our streets were a lot calmer– reduction in traffic, more human-centered.There’s even better air quality. When you don’t get that taste of exhaust in the air, you’re more likely to get on your bike.”
Not all have abided by the stay-at-home order, particularly at beaches on Memorial Day weekend. On the whole, however, traffic data shows that most residents are staying home, even as the lockdown has dragged on. Nonetheless, confirmed cases of COVID-19 in the county continue to rise.
Crosstown examined weekend vehicle-volume data for six areas around Los Angeles from April 11 through May 31. We compared it with average vehicle-volume from five months earlier, before the COVID-19 pandemic hit. The data collected measures the number of vehicles traveling on major arterial roadways, such as Wilshire, Sepulveda and Ventura Boulevards. The data does not include freeway traffic.
No reason to leave home
Fraser Shilling, a researcher at the Road Ecology Center at the University of California, Davis, said there are a few reasons that are holding the traffic levels low. First, there is still a high degree of concern about the virus that is keeping people at home.
“Just because the government wants to save the economy, despite risks to people, it doesn’t mean people are sold on the idea,” he said. “Many people have lost their jobs, making driving less necessary and just another expense maybe they can’t afford. Declines in Los Angeles weekday traffic have also held steady.
This reduction in automobile traffic has not yet made LA’s streets a mecca for cyclists. According to a joint statement from the Los Angeles Police Department, the Los Angeles Bicycle Coalition and others, fatal car crashes were up by 15% in mid-May, compared with the same time last year.
“A few drivers used the unusually open streets as an excuse to speed and drive recklessly,” the statement said.
Ted Rogers, the editor of BikinginLA, said that cyclists are reveling in the traffic lull; they just fear it will not last.
“They’re really worried about the changes as we reopen and traffic picks back up,” Rogers said. He added that a number of big cities have installed pop-up bike lanes for a temporary solution to give cyclists more room.
But Los Angeles is not one of them, he noted. “So now, new bike riders are going to get chased off the street back into their cars, and traffic will be worse than ever.”
The Bicycle Coalition is pushing for changes in infrastructure to keep new cyclists biking.
“As we move towards recovery, we have to ask the question of what a resilient future looks like,” said Kaufman of the Bicycle Coalition. “And we believe that if you’re on a bike, you’re a member of every community you ride through.”
How we did it: We examined data compiled for the Archived Transportation Data Management System, which was created by the Integrated Media Systems Center at the University of Southern California.
The ADMS traffic map tracks vehicle volumes for various neighborhoods. We compared current weekend volume data for each area with traffic volume from five months earlier.
To calculate median traffic volumes from the period prior to the coronavirus shutdown, we selected levels that fell in the middle of the range of traffic volumes for an average week. When hourly average data was incomplete or unavailable for parts of certain days, we created averages using days of the week for which data was available. Learn more about our data here.
Want to know how your neighborhood fares? Or simply just interested in our data? Email us at askus@xtown.la.


