

A coronavirus-induced crime drop


As the coronavirus pandemic has surged, crime has fallen sharply in the City of Los Angeles. There were 98,140 crimes reported during the first six months of 2020, an 8.5% drop from the same period in 2019, according to Los Angeles Police Department data.
The drop includes an 8.7% decrease in violent crime (a category that includes aggravated assaults and domestic violence) during the first six months of this year. According to the LAPD, in a majority of incidents, a suspect’s weapon of choice was their hands, fist, feet or other body parts; this category accounted for 64% of all reported violent crimes.
However, the decrease has not been even: Hate crime is rising in the city, murders are up and there has been a spike in vehicle thefts as people leave their cars on the streets for extended periods.
Total crime in LA by month 2020 vs. 2019
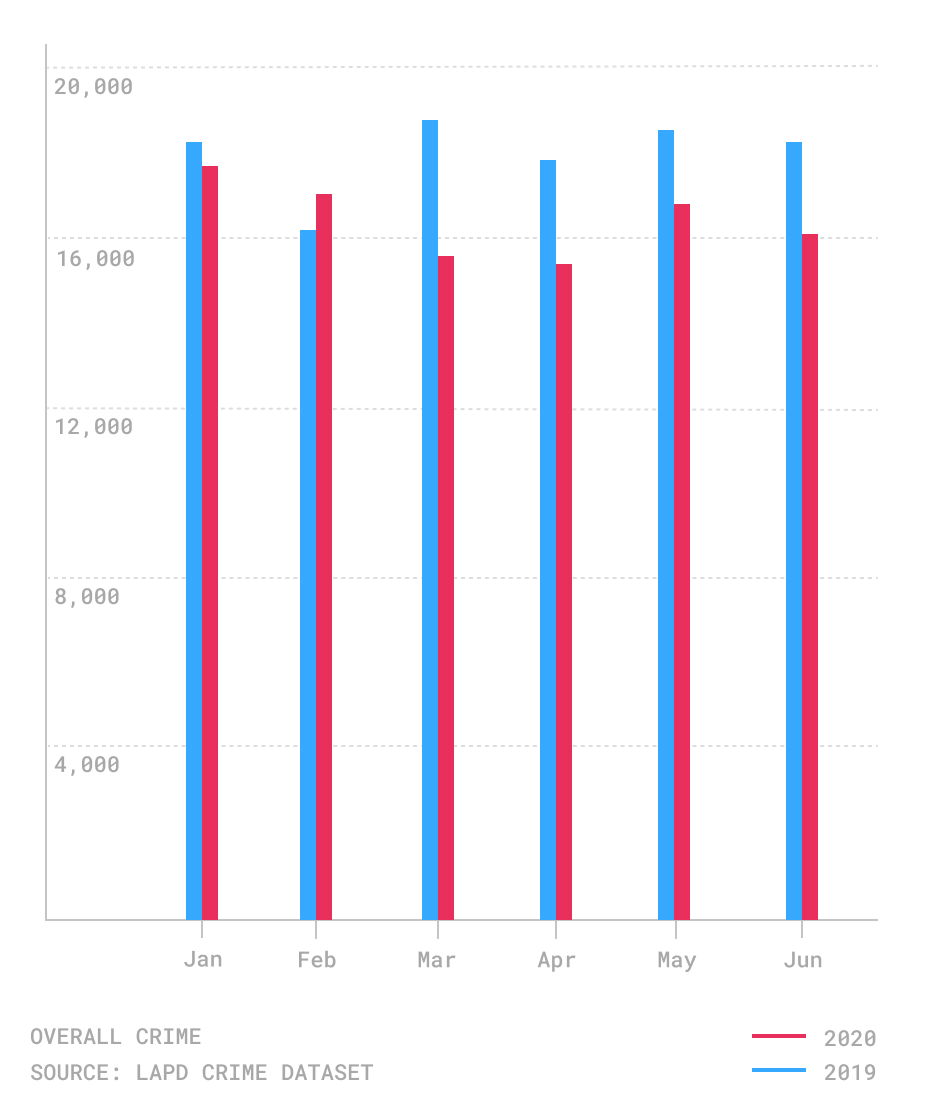
Graphics by Kiera Smith
Crime numbers began to fall abruptly in March and April, when Mayor Eric Garcetti enacted the Safer-at-Home initiative in the effort to slow the spread of the coronavirus. The city saw about 15,000 crimes in each of those months, down from about roughly 18,000 the previous year. In June, there were 16,018 reports, compared with roughly 18,000 in the same month last year.
Eighty-eight neighborhoods saw a decrease in crime in the first half of the year, while 19 neighborhoods experienced an increase compared with the same time last year.
LA neighborhoods with sharpest crime drop during 2020
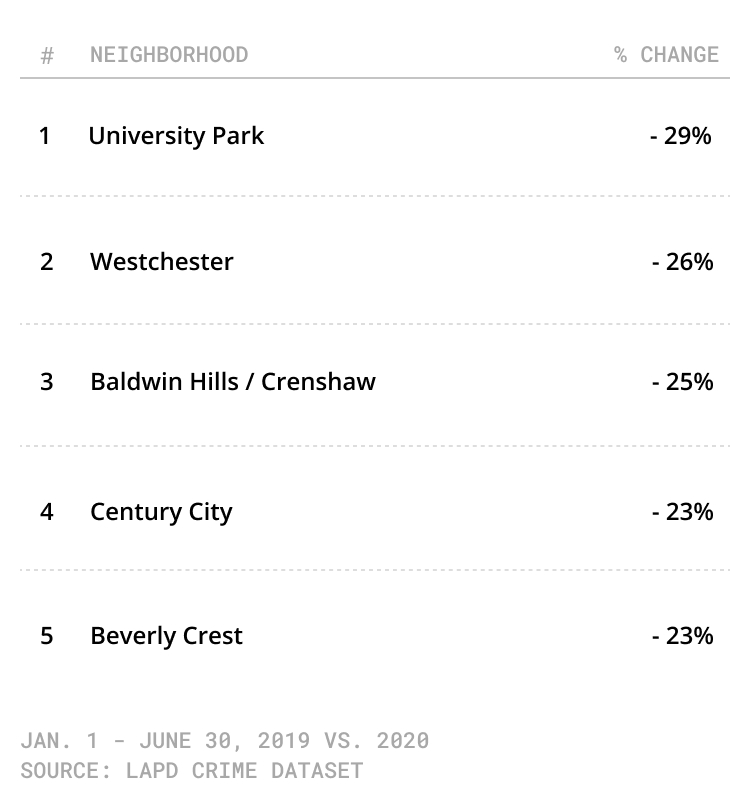
Among the neighborhoods that saw steep crime decreases were University Park, Westchester and Baldwin Hills/Crenshaw, which all dropped at least 25% during the first six months of this year.
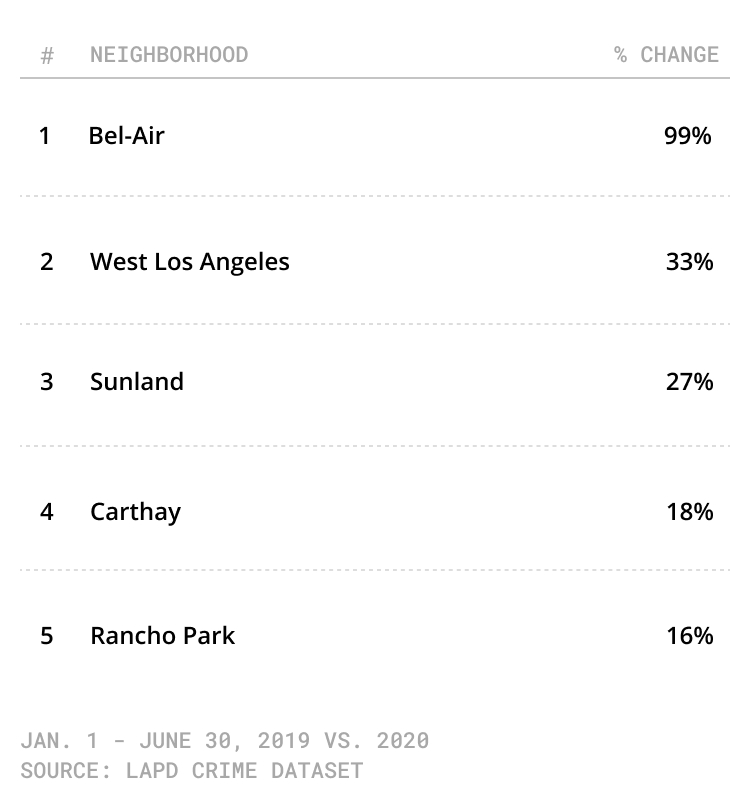
By contrast, the wealthy enclave of Bel Air saw the highest spike in reported crime during the first half of the year, with 139 incidents, a 99% increase from the same time period last year.
LA neighborhoods with biggest jump in crime during 2020
In University Park, a diverse South LA neighborhood and home to the University of Southern California, crime fell 29% during the first half of the year, as many students left as the COVID-19 shutdown orders went into effect. The neighborhood was designated as a historic preservation “overlay zone” by the City Council in 2000. Ken Bernstein, the principal city planner who oversees the Office of Historic Resources, said creating these zones had the added benefit of “creating a sense of healthy community” which could contribute to a drop in crime, as well as fewer people being in the neighborhood amid the coronavirus pandemic.
“When neighbors know one another and watch out for one another, that has benefits, like leading to a reduction in crime levels,” he said.
Bernstein’s office is also looking at how land planning can promote racial equity and justice to undercut systemic racism in communities like University Park.
“Our primary role is meant to serve the larger community and to make sure the communities we create minimize levels of violence,” he said.
The crime category that has seen the biggest jump this year is stolen vehicles, up 30% from the same time in 2019. The increase followed the stay at home orders, which resulted in more cars being parked for longer periods of time.
Other changes include a 12% drop in reports of simple battery assault, and vehicle break-ins, which is down nearly 9% from the same time last year.
We examined crime statistics for 110 neighborhoods in the City of Los Angeles and ranked them by crime rate. Downtown, Vermont Square and Vermont-Slauson had the highest crime rate per 100,000 people, while Porter Ranch, Beverly Crest and Mount Washington recorded the lowest levels during the first half of this year.
Drew Paonessa, president of the Arroyo Seco Neighborhood Council, said he is “more than pleased” Mt. Washington had a 15% drop in crime, and that residents in recent months mostly complained about fireworks or speeding on certain streets. He attributed the decrease to more people walking in the neighborhood, but noted the need to be proactive when dealing with the community’s concerns.
“As a council, we have to think about what factors contribute to crime, and what we can do with our resources to address issues such as economic concerns, housing, issues of racial justice, and access to food,” said Paonessa. “These issues, among others, are all factors that can be the difference between stability and instability in the community.”
Click on the arrows in the table to sort by category. Click once to see the category in ascending order, and again to see it in descending order. You can use the search bar to see how your neighborhood compares to others. The neighborhoods are listed in alphabetical order.
| Neighborhood | Total reported crimes Jan.-June 2020 | Total reported crimes Jan.-June 2019 | Total population | % change | Crime rate Jan.-June 2020 |
| Bel-Air | 139 | 70 | 7615 | 99% | 1825 |
| West Los Angeles | 390 | 293 | 12888 | 33% | 3026 |
| Sunland | 298 | 234 | 14614 | 27% | 2039 |
| Carthay | 157 | 133 | 5356 | 18% | 2931 |
| Rancho Park | 109 | 94 | 5531 | 16% | 1971 |
| Wilmington | 1,457 | 1,263 | 58161 | 15% | 2505 |
| Tujunga | 404 | 356 | 27328 | 13% | 1478 |
| El Sereno | 675 | 614 | 42077 | 10% | 1604 |
| Reseda | 1,378 | 1,264 | 71569 | 9% | 1925 |
| Pacific Palisades | 314 | 289 | 24990 | 9% | 1257 |
| Lakeview Terrace | 184 | 173 | 13579 | 6% | 1355 |
| Mar Vista | 524 | 495 | 37833 | 6% | 1385 |
| Palms | 775 | 739 | 42746 | 5% | 1813 |
| Playa Vista | 262 | 252 | 11126 | 4% | 2355 |
| Sylmar | 1,279 | 1,234 | 80327 | 4% | 1592 |
| Toluca Lake | 197 | 195 | 9192 | 1% | 2143 |
| Arleta | 395 | 391 | 33780 | 1% | 1169 |
| Harvard Heights | 556 | 552 | 19497 | 1% | 2852 |
| Larchmont | 174 | 173 | 8595 | 1% | 2024 |
| Pico-Robertson | 414 | 413 | 18307 | 0% | 2261 |
| Chinatown | 382 | 383 | 13687 | 0% | 2791 |
| Playa Del Rey | 207 | 209 | 11434 | -1% | 1810 |
| Vermont Slauson | 1,197 | 1,210 | 21634 | -1% | 5533 |
| Highland Park | 853 | 865 | 53013 | -1% | 1609 |
| Brentwood | 533 | 548 | 32865 | -3% | 1622 |
| Adams-Normandie | 445 | 458 | 17925 | -3% | 2483 |
| Historic South Central | 1,688 | 1,741 | 48700 | -3% | 3466 |
| Westlake | 2,979 | 3,075 | 107760 | -3% | 2764 |
| Florence | 1,778 | 1,837 | 52639 | -3% | 3378 |
| Vermont Vista | 962 | 995 | 49385 | -3% | 1948 |
| Los Feliz | 713 | 742 | 21296 | -4% | 3348 |
| Harbor Gateway | 952 | 992 | 41308 | -4% | 2305 |
| Westwood | 649 | 678 | 53050 | -4% | 1223 |
| Pacoima | 1,377 | 1,445 | 76726 | -5% | 1795 |
| Arlington Heights | 495 | 520 | 23768 | -5% | 2083 |
| Harbor City | 449 | 472 | 25833 | -5% | 1738 |
| Glassell Park | 410 | 433 | 24084 | -5% | 1702 |
| Pico-Union | 1,220 | 1,293 | 42187 | -6% | 2892 |
| North Hollywood | 2,151 | 2,281 | 81849 | -6% | 2628 |
| Central Alameda | 867 | 925 | 43129 | -6% | 2010 |
| Encino | 816 | 878 | 45712 | -7% | 1785 |
| San Pedro | 1,637 | 1,766 | 80601 | -7% | 2031 |
| Sun Valley | 1,608 | 1,740 | 71743 | -8% | 2241 |
| Green Meadows | 1,160 | 1,258 | 34848 | -8% | 3329 |
| Montecito Heights | 250 | 272 | 17724 | -8% | 1411 |
| Koreatown | 2,525 | 2,754 | 107316 | -8% | 2353 |
| Valley Glen | 1,288 | 1,411 | 58495 | -9% | 2202 |
| Shadow Hills | 208 | 228 | 12999 | -9% | 1600 |
| Woodland Hills | 1,481 | 1,626 | 67139 | -9% | 2206 |
| Hollywood Hills West | 327 | 361 | 15965 | -9% | 2048 |
| Fairfax | 719 | 794 | 13484 | -9% | 5332 |
| Beverly Grove | 915 | 1,014 | 22023 | -10% | 4155 |
| Mid-City | 1,253 | 1,389 | 51962 | -10% | 2411 |
| Van Nuys | 2,826 | 3,133 | 111635 | -10% | 2531 |
| Echo Park | 834 | 927 | 34950 | -10% | 2386 |
| Granada Hills | 863 | 960 | 53296 | -10% | 1619 |
| Sawtelle | 1,045 | 1,163 | 42223 | -10% | 2475 |
| North Hills | 1,107 | 1,235 | 62414 | -10% | 1774 |
| Vermont Square | 1,563 | 1,746 | 26836 | -10% | 5824 |
| East Hollywood | 1,458 | 1,633 | 68503 | -11% | 2128 |
| Northridge | 1,364 | 1,530 | 67555 | -11% | 2019 |
| Hancock Park | 287 | 324 | 10774 | -11% | 2664 |
| Windsor Square | 131 | 148 | 6694 | -11% | 1957 |
| Venice | 1,376 | 1,560 | 34048 | -12% | 4041 |
| Downtown | 6,265 | 7,128 | 50085 | -12% | 12509 |
| Watts | 1,187 | 1,354 | 44939 | -12% | 2641 |
| Chatsworth | 810 | 924 | 50435 | -12% | 1606 |
| Cheviot Hills | 153 | 175 | 8747 | -13% | 1749 |
| Leimert Park | 467 | 536 | 12566 | -13% | 3716 |
| West Hills | 616 | 709 | 39299 | -13% | 1567 |
| Broadway-Manchester | 1,223 | 1,408 | 28280 | -13% | 4325 |
| Lake Balboa | 388 | 447 | 27115 | -13% | 1431 |
| Cypress Park | 232 | 269 | 9786 | -14% | 2371 |
| Panorama City | 1,304 | 1,514 | 70212 | -14% | 1857 |
| Sherman Oaks | 1,341 | 1,559 | 71575 | -14% | 1874 |
| Vermont Knolls | 891 | 1,036 | 24031 | -14% | 3708 |
| Atwater Village | 226 | 264 | 11206 | -14% | 2017 |
| Boyle Heights | 2,269 | 2,651 | 92036 | -14% | 2465 |
| South Park | 925 | 1,083 | 33339 | -15% | 2775 |
| Exposition Park | 1,080 | 1,268 | 35235 | -15% | 3065 |
| Mount Washington | 151 | 178 | 14201 | -15% | 1063 |
| Studio City | 931 | 1,099 | 39851 | -15% | 2336 |
| Hollywood | 3,298 | 3,895 | 73119 | -15% | 4510 |
| Tarzana | 751 | 887 | 37739 | -15% | 1990 |
| Gramercy Park | 314 | 371 | 10666 | -15% | 2944 |
| Mission Hills | 361 | 428 | 18747 | -16% | 1926 |
| Elysian Valley | 114 | 136 | 7404 | -16% | 1540 |
| Winnetka | 787 | 940 | 53895 | -16% | 1460 |
| Beverlywood | 81 | 97 | 7244 | -16% | 1118 |
| Jefferson Park | 526 | 630 | 25339 | -17% | 2076 |
| Silver Lake | 659 | 792 | 31189 | -17% | 2113 |
| Valley Village | 490 | 589 | 25746 | -17% | 1903 |
| Mid-Wilshire | 996 | 1,199 | 42682 | -17% | 2334 |
| Eagle Rock | 443 | 534 | 34233 | -17% | 1294 |
| Del Rey | 457 | 551 | 30010 | -17% | 1523 |
| West Adams | 552 | 671 | 21328 | -18% | 2588 |
| Harvard Park | 409 | 502 | 9423 | -19% | 4340 |
| Canoga Park | 1,515 | 1,872 | 59641 | -19% | 2540 |
| Chesterfield Square | 269 | 334 | 8247 | -19% | 3262 |
| Lincoln Heights | 606 | 759 | 28649 | -20% | 2115 |
| Porter Ranch | 243 | 308 | 26040 | -21% | 933 |
| Manchester Square | 383 | 487 | 11516 | -21% | 3326 |
| Hyde Park | 993 | 1,268 | 35461 | -22% | 2800 |
| Elysian Park | 89 | 114 | 2386 | -22% | 3730 |
| Beverly Crest | 112 | 145 | 11266 | -23% | 994 |
| Century City | 185 | 240 | 6175 | -23% | 2996 |
| Baldwin Hills/Crenshaw | 1,013 | 1,342 | 29672 | -25% | 3414 |
| Westchester | 1,423 | 1,911 | 41193 | -26% | 3454 |
| University Park | 629 | 886 | 24170 | -29% | 2602 |
How we did it: We examined publicly available LAPD data on reported crimes in the City of Los Angeles. For neighborhood boundaries, we rely on the borders defined by the Los Angeles Times. Learn more about our data here.
LAPD data only reflects crimes that are reported to the department, not how many crimes actually occurred. In making our calculations, we rely on the data the LAPD makes publicly available.
The LAPD periodically updates past crime reports with new information, leading the department to recategorize past reports. Additionally, revised reports do not always automatically become part of the public database. But, we will keep monitoring hate crimes in the City of Los Angeles.
Want to know how your neighborhood fares? Or simply just interested in our data? Email us at askus@xtown.la.


