

COVID-19 case spike? It might be Wednesday


Concern flared on Oct. 7, when the Los Angeles County Department of Public Health released its daily coronavirus update: There were 1,645 new confirmed cases of COVID-19, the highest single-day tally since August. News reports took note of the sudden rise.
But one driver of the precipitous jump went overlooked: It was a Wednesday, the day of the week when numbers often spike. In fact, on Monday, Oct. 5, just two days earlier, the county reported only 472 new cases.
It turns out, such variations in case numbers are par for the course. An analysis of Public Health data since July 26 (around the time county case levels began consistently dropping after a summer spike) reveals a stark but consistent contrast in new case numbers depending on the day of the week. Counts tend to be low at the start of the traditional workweek, then abruptly spike.
[Related: The bright spot in LA’s coronavirus counts]
The true rate of spread of the virus is usually somewhere in the middle. That’s why many public health experts use a different metric – the seven-day moving average. (Crosstown reports the seven-day moving average of new cases and deaths on its Twitter and Instagram accounts daily.)
A weekly cycle
In a 10-week period from July 26-Oct. 3, the Public Health department recorded an average of 1,154 new cases on Mondays, just above the 1,151 cases on Tuesdays.
Average new case count by day of the week, July 26-Oct. 3
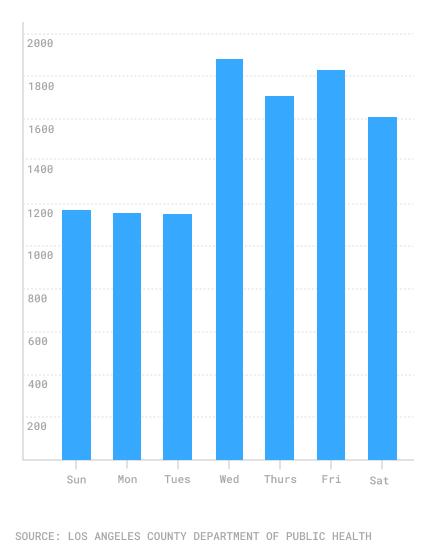
Then, numbers soar. In that same timeframe, there is an average of 1,880 new cases reported on Wednesdays, a spike of about 63%. Fridays bring an average of 1,829 new cases.
The level decreases on Saturdays, falls dramatically on Sundays, and then the cycle tends to repeat.
This does not mean that the virus is any more prevalent or dangerous on one day of the week than another. Rather, the early-week dip can usually be attributed to a lag in reporting numbers over the weekend, as it can take several days for lab results from across the region to reach the Public Health Department and be assimilated into the coronavirus database. When the department’s daily update on Monday, Sept. 28, announced 663 new cases, the headline boasted that it was the lowest figure since March, but also warned about the weekend reporting lag.
The virus doesn’t take holidays, but labs do
Other factors can skew daily figures. Holiday weekends can produce misleadingly low numbers. The wildfires that flared across the region in September forced some testing locations to temporarily close, shrinking the number of new cases for several days. For example, on Wednesday (usually a high count day), Sept. 8, as the Bobcat Fire burned, the Public Health department reported just 671 new cases. The next day, there were 1,239 cases.
Local leaders have been adamant that occasional low numbers, even if consistent over days or weeks, do not mean that life can return to normal and businesses can fully reopen, or that people are any more protected from COVID-19 than they were months earlier.
“[The] virus remains very dangerous,” Mayor Garcetti warned during a City Hall media briefing on Friday evening. “It doesn’t matter who you are. It doesn’t matter what protections you think you have.”
County Public Health Director Dr. Barbara Ferrer made a similar point last week as she stressed the need to maintain safety protocols.
“While we have seen significant improvement since the summer, daily case numbers indicate COVID-19 continues to spread across L.A. County at high enough rates to limit the reopening of businesses and schools,” Ferrer said in a statement in the department’s Oct. 6 update. “If we work together to limit transmission, and slow the spread of COVID-19 to 700 or less new cases per day, not only will the County move to a less restrictive tier that allows us to consider additional re-openings, we will save lives.”
Benefits of being average
The seven-day moving average offers a more consistent number because it takes into account the occasional peaks, valleys and reporting delays. The Public Health department’s COVID-19 dashboard reveals that the highest seven-day average during the crisis occurred on July 13, when the level hit 2,959 new cases.
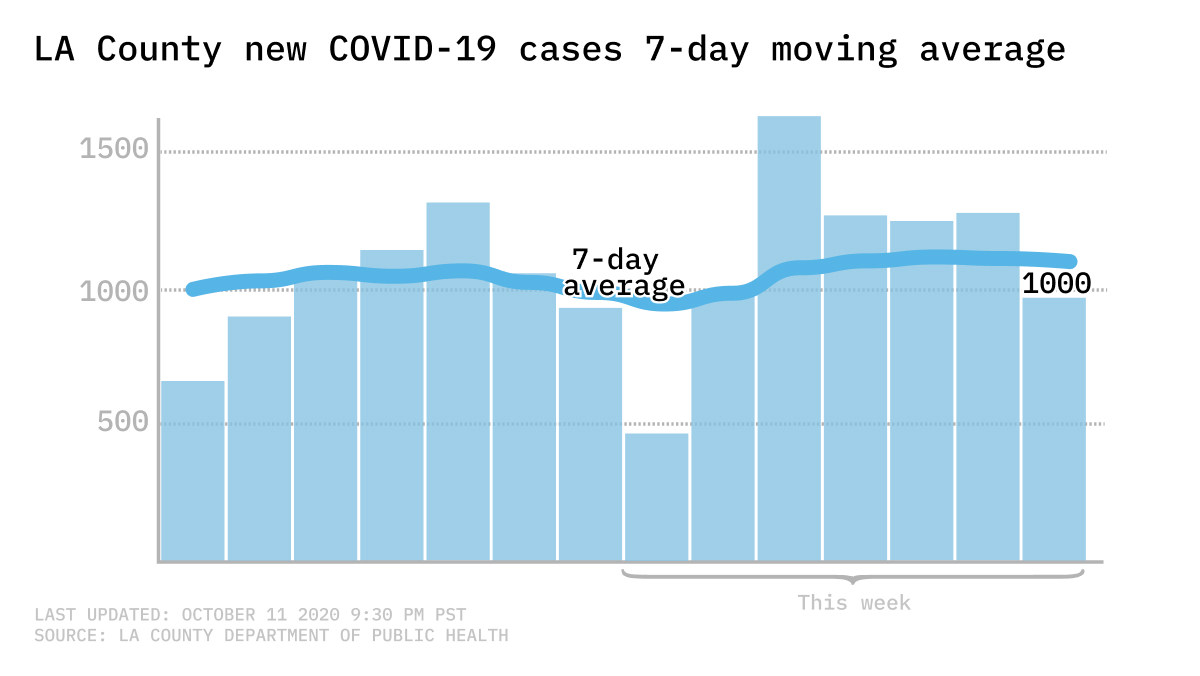
A strict regimen of new safety measures soon had an impact on the spread. Four weeks later, on Aug. 10, the seven-day average stood at 1,700. On Sept. 14, two months after the peak, the seven-day average of new cases had fallen all the way to 878.
The average has been in a fairly tight range for much of the past month, bouncing in the vicinity of 900–that keeps the average new case load well above the Monday dips, and below the Wednesday spikes.
How we did it: We examined the daily COVID-19 updates issued by the Los Angeles County Department of Public Health, and also consulted the department’s Cumulative and Daily Cases and Deaths dashboard.
Got a question? Interested in our data? Email us at askus@xtown.la.


