

Car break-ins were Los Angeles’ most common crime in 2020


Car break-ins were the crime of the decade in the 2010s in Los Angeles, accounting for one in every eight criminal incidents recorded. While the number of reports fell last year, the trend is holding.
Theft from a vehicle was the most common crime of 2020, according to Los Angeles Police Department data. The LAPD reported 26,770 car break-ins last year, and while that is down nearly 14% from the 31,112 incidents in 2019, it still worked out to an average of 73 break-ins a day.
Most common crimes in Los Angeles, 2020 vs. 2019
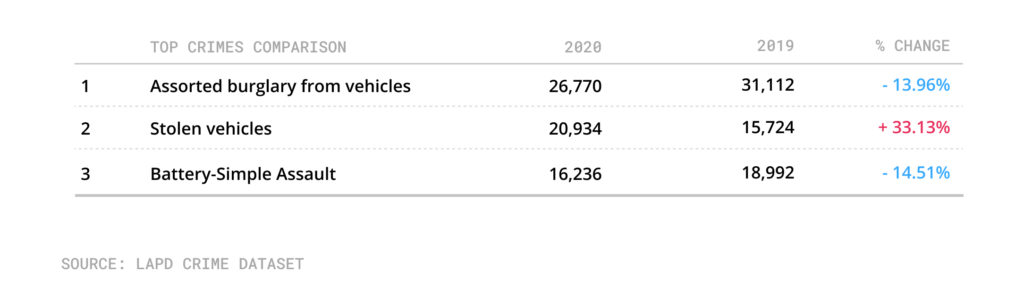
The second most common crime in 2020 was car theft. The 20,934 stolen vehicles represent a 33% increase from the 15,724 reported in 2019.
Much of the increase has been attributed to cars that remained on the street for extended periods during the coronavirus pandemic. A spike began in the spring, following the stay-at-home order issued by Mayor Eric Garcetti in March. More cars parked on the street, combined with virtually no parking enforcement in much of the city, resulted in cars sitting unattended for long periods of time.
Capt. Paul Vernon, who is in charge of the LAPD’s Compstat Division, said car thieves “saw an open season to steal cars” with so many remaining in the same place.
Boyle Heights, Downtown and Van Nuys were the top neighborhoods where cars were broken into or stolen last year. Westlake, Historic South-Central and Koreatown also were hot spots for thieves.
Neighborhoods with the most vehicle thefts in 2020

The LAPD has pushed a “lock it, hide it, keep it” campaign, warning that clearly visible valuables are a lure for opportunistic thieves.
The third most frequently reported crime in 2020 was simple assault. There were 16,236 incidents of battery reported to the LAPD in 2019, a decrease of 14.5% from 2019, when there were 18,992 instances.
How we did it: We examined publicly available crime data from the Los Angeles Police Department from Jan. 1-Dec. 31, 2020, compared with the same time period last year. Learn more about our data here.
LAPD data only reflects crimes that are reported to the department, not how many crimes actually occurred. In making our calculations, we rely on the data the LAPD makes publicly available. LAPD may update past crime reports with new information, or recategorize past reports. Those revised reports do not always automatically become part of the public database.
Want to know how your neighborhood fares? Or simply just interested in our data? Email us at askus@xtown.la.


