

Hate crimes increase for seventh consecutive year


Hate crimes rose by 16% in the city of Los Angeles last year, with 379 reports fielded by the Los Angeles Police Department, well above the 326 in 2019. The increase also stands in sharp contrast to the city’s overall 11% crime drop.
Seventy-nine reports involved assault with a deadly weapon, making up nearly 21% of all reported hate crimes, according to Los Angeles Police Department data. In 2019, 17% of reported hate crimes involved an assault with a deadly weapon classification.
Brian Levin, director of the Center for the Study of Hate and Extremism at California State University, San Bernardino, said the number of aggravated assaults is significant and reflects a statewide and national trend.
“We are seeing a pattern,” said Levin.
There were 77 reports of hate crimes involving what the LAPD terms simple assault, making up 20% of cases.
Defining the crime
The LAPD defines a hate crime as “any criminal act or attempted criminal act directed against a person or persons based on the victim’s actual or perceived race, nationality, religion, sexual orientation, disability or gender.”
These are not to be confused with “hate incidents,” which typically include instances of abuse involving racial, gender or sexual-orientation bias, but do not result in a formal crime report.
Hate incidents increased by nearly 142% last year. The 104 reports in 2020 is far above the 43 in 2019.
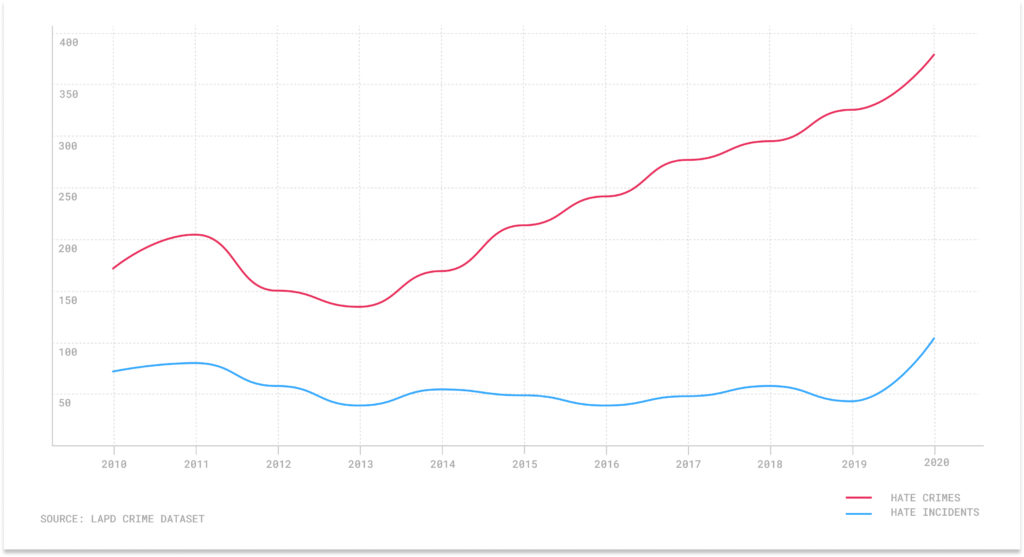
This marks the seventh consecutive year of an increase in reported hate crimes in Los Angeles. Non-criminal hate incidents have fluctuated since the LAPD began making its data publicly available in 2010, but last year also stands as a record high.
Hate crimes and incidents, 2010-2020
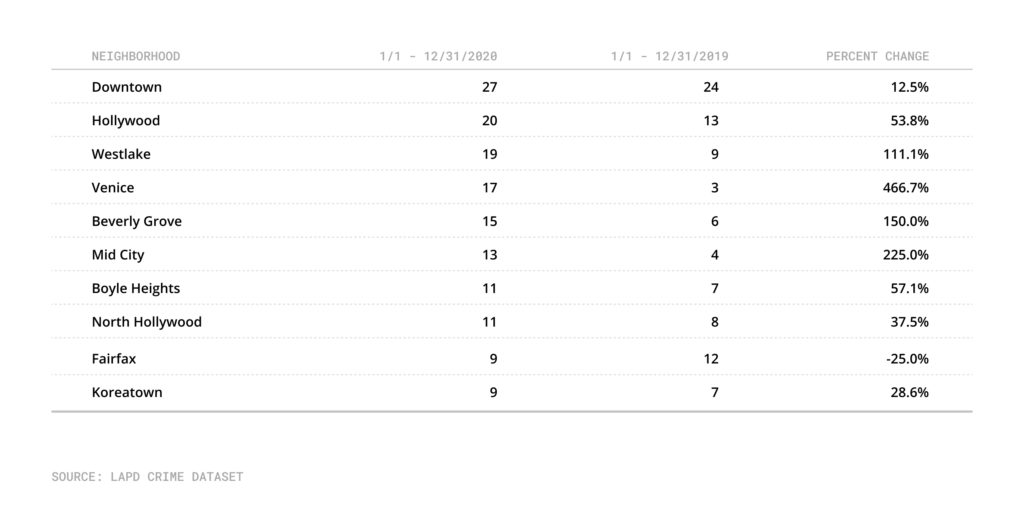
Downtown recorded the highest number of hate crimes in the city last year, with 27 reports, up 12.5% from the 24 in 2019. Venice saw the highest rate of increase, with 17 hate crimes, a nearly 467% rise over the three in 2019. Fairfax ranked in the top 10 in number of crimes, but still saw a 25% decrease, going from 12 reports in 2019 to nine last year.
Beverly Grove reported 12 hate incidents last year, a 300% increase from the three in 2019. Fairfax, which had just one hate incident in 2019, saw 10 last year.
Neighborhoods with the greats number of hate crimes in 2020
Experts stress that the numbers are inexact, and hate crimes are underreported because victims often do not trust the police will do anything about it. In other instances, victims may be unaware they can report what happened. The Bureau of Justice Statistics estimates that less than half of all hate crimes are reported to law enforcement.
The LAPD has expanded how it records hate crimes and incidents motivated by intolerance. It now encompasses 35 categories including anti-Black, anti-Jewish and anti-transgender. These are the same codes the FBI uses to track bias-motivated offenses.
New Los Angeles County District Attorney George Gascón initially said he would not seek longer prison sentences for people accused of hate crimes, but reversed course after backlash from prosecutors and victims’ advocates.
Reports across the board
The LAPD last year recorded 94 hate crimes or incidents against LGBTQ+ people, including 18 targeting transgender individuals. There were 80 instances where Black people were targeted in hate crimes or incidents specifically because of their race, a 43% increase over the 56 in 2019.
There were 51 instances of anti-Jewish bias in 2020. Bias against Asian people rose to 19 reported instances, up from nine in 2019.
Levin said some local increases correspond to national trends, with anti-Asian crimes tied to stereotyping from the coronavirus pandemic, and anti-Black crimes related to the social justice movement.
“The stereotypes about these publicized events take a nefarious left turn and could be responsible,” said Levin.
Levin said it would not be unusual for hate crime numbers to decrease in Los Angeles following further investigation, because after they are vetted they may count as something else. Still, the fact that 2020 totals are above 2019 is “saying a lot.”
Levin said he is worried for 2021 as well.
“Nationally, I’m concerned what’s going to happen to these militant far-right folks who now see their access to social media limited and their leader, the president, hobbled,” he said. “I think that’s going to bring an extremist angle and bring in more do-it-yourselfers who don’t operate as part of the large groups we’ve been seeing.”
How we did it: We examined LAPD publicly available data on reported hate crimes and hate incidents from Jan. 1, 2010-Dec. 31, 2020. For neighborhood boundaries, we rely on the borders defined by the Los Angeles Times. Learn more about our data here.
In making our calculations, we rely on the data the LAPD makes publicly available. On occasion, LAPD may update past crime reports with new information, or recategorize past reports. Those revised reports do not always automatically become part of the public database.
Want to know how your neighborhood fares? Or simply just interested in our data? Email us at askus@xtown.la.


