

Crime fell in Los Angeles last year, but not for everyone


Overall crime in Los Angeles fell nearly 11% last year. As the coronavirus pandemic upended life across the region, there were 192,438 crimes reported in the city, down from the 215,763 in 2019, according to Los Angeles Police Department data.
The decrease was not even. Although 92 neighborhoods saw a drop in reported crime, levels rose in 15 neighborhoods. Moreover, murders and shootings across the city soared to their highest levels in years.
University Park, a diverse South Los Angeles neighborhood, saw the steepest decrease, with the 1,168 reported incidents representing a 38% drop from the 1,889 reported in 2019. Factors contributing to the fall include a limited number of students at the University of Southern California due to the pandemic, and a tight base of neighbors looking out for one another.
Neighborhoods with the greatest crime decrease in 2020
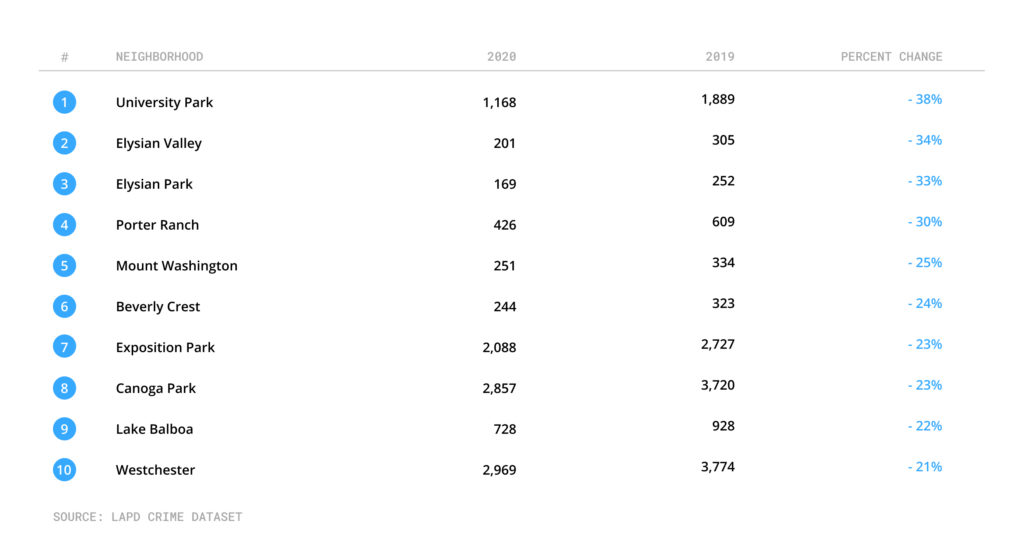
University Park saw 164 thefts last year, down 54% from the 360 in 2019. There was also a steep decline in stolen bikes, from 408 in 2019 to 141 in 2020.
However, University Park did see an increase in stolen cars, with 92 reports, up from 54 in 2019. The 70% increase far surpassed the citywide 33% uptick in stolen vehicles last year.
Elysian Valley recorded the second-biggest decline, with 201 reported crimes, down 34% from the 305 incidents in 2019. Although there was a slight uptick in stolen cars, the community saw just 31 thefts from a vehicle, a marked drop from the 96 in 2019.
Neighborhoods with the most crime reports in 2020
Downtown recorded the greatest number of crimes last year. However, the 12,076 incidents in the densely packed area marked a 17% decrease from 2019.
A similar rate of decline was seen in heavily trafficked Hollywood, which had the second-highest number of incidents. The 6,541 reported crimes were down 16% from the previous year.
The neighborhood with the greatest increase in crime was Bel-Air, where the 252 reported incidents was a 39% rise from the 181 in 2019. Although the baseline is small, the increase for the typically safe enclave was attributed to burglaries, vehicle break-ins and trespassing.
Neighborhoods with the greatest crime increase in 2020
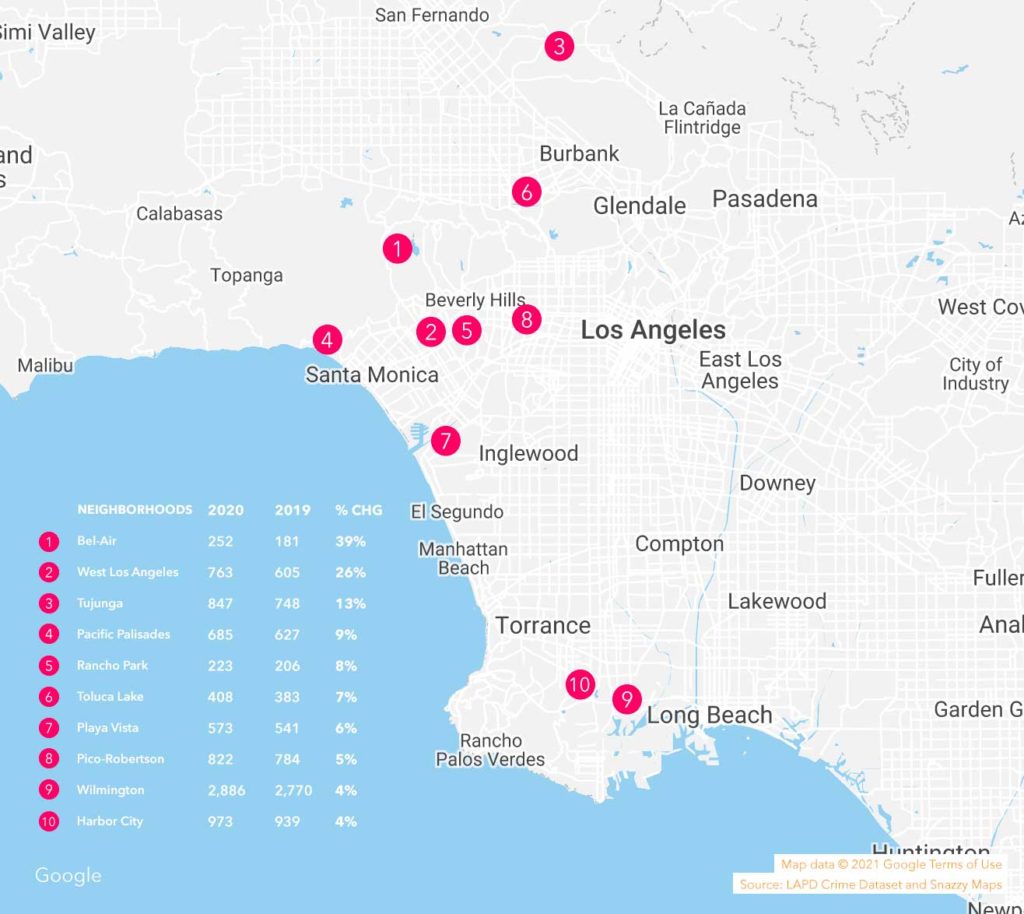
The second-biggest rate of increase was seen in West Los Angeles, where the 763 reported crimes last year were up 26% over the 605 in 2019. Burglary and vehicle break-ins accounted for 37% of incidents reported to the LAPD.
Not all reported crimes involve weapons. According to the LAPD, in a majority of incidents in which one was wielded, a suspect’s weapon of choice was their hands, fist, feet or other body part. Department data also reveals that 38% of reported crimes happened on the street, sidewalk or parking lot. Single-family and multi-unit dwellings were the site of 28% of crimes.
Crosstown examined crime statistics for 110 neighborhoods in the city of Los Angeles and ranked them by crime rate. Click on the arrows in the table to sort by category. You can use the search bar to see how your neighborhood compares to others. Neighborhoods are listed in alphabetical order.
| Neighborhood | Total reported crimes Jan.-Dec. 2020 | Total reported crimes Jan.-Dec. 2019 | Total population | % change | Crime rate Jan.-Dec. 2020 |
| Adams-Normandie | 925 | 946 | 17925 | -2% | 5160 |
| Arleta | 752 | 816 | 33780 | -8% | 2226 |
| Arlington Heights | 1019 | 1026 | 23768 | -1% | 4287 |
| Atwater Village | 453 | 539 | 11206 | -16% | 4042 |
| Baldwin Hills/Crenshaw | 2,012 | 2,487 | 29672 | -19% | 6781 |
| Bel-Air | 252 | 181 | 7615 | 39% | 3309 |
| Beverly Crest | 244 | 323 | 11266 | -24% | 2166 |
| Beverly Grove | 1,743 | 2,061 | 22023 | -15% | 7914 |
| Beverlywood | 171 | 201 | 7244 | -15% | 2361 |
| Boyle Heights | 4,579 | 5,121 | 92036 | -11% | 4975 |
| Brentwood | 1088 | 1078 | 32865 | 1% | 3311 |
| Broadway-Manchester | 2,462 | 2,713 | 28280 | -9% | 8706 |
| Canoga Park | 2,857 | 3,720 | 59641 | -23% | 4790 |
| Carthay | 279 | 318 | 5356 | -12% | 5209 |
| Central Alameda | 1702 | 1870 | 43129 | -9% | 3946 |
| Century City | 407 | 504 | 6175 | -19% | 6591 |
| Chatsworth | 1579 | 1858 | 50435 | -15% | 3131 |
| Chesterfield Square | 582 | 679 | 8247 | -14% | 7057 |
| Cheviot Hills | 272 | 322 | 8747 | -16% | 3110 |
| Chinatown | 679 | 808 | 13687 | -16% | 4961 |
| Cypress Park | 467 | 540 | 9786 | -14% | 4772 |
| Del Rey | 990 | 1130 | 30010 | -12% | 3299 |
| Downtown | 12,076 | 14,548 | 50085 | -17% | 24111 |
| Eagle Rock | 879 | 1033 | 34233 | -15% | 2568 |
| East Hollywood | 2,936 | 3,168 | 68503 | -7% | 4286 |
| Echo Park | 1624 | 1854 | 34950 | -12% | 4647 |
| El Sereno | 1222 | 1191 | 42077 | 3% | 2904 |
| Elysian Park | 169 | 252 | 2386 | -33% | 7083 |
| Elysian Valley | 201 | 305 | 7404 | -34% | 2715 |
| Encino | 1659 | 1796 | 45712 | -8% | 3629 |
| Exposition Park | 2,088 | 2,727 | 35235 | -23% | 5926 |
| Fairfax | 1325 | 1625 | 13484 | -18% | 9826 |
| Florence | 3,587 | 3,741 | 52639 | -4% | 6814 |
| Glassell Park | 735 | 931 | 24084 | -21% | 3052 |
| Gramercy Park | 643 | 736 | 10666 | -13% | 6029 |
| Granada Hills | 1630 | 1965 | 53296 | -17% | 3058 |
| Green Meadows | 2,348 | 2,474 | 34848 | -5% | 6738 |
| Hancock Park | 597 | 661 | 10774 | -10% | 5541 |
| Harbor City | 973 | 939 | 25833 | 4% | 3767 |
| Harbor Gateway | 1962 | 2053 | 41308 | -4% | 4750 |
| Harvard Heights | 1050 | 1123 | 19497 | -7% | 5385 |
| Harvard Park | 748 | 946 | 9423 | -21% | 7938 |
| Highland Park | 1537 | 1690 | 53013 | -9% | 2899 |
| Historic South Central | 3,354 | 3,574 | 48700 | -6% | 6887 |
| Hollywood | 6,541 | 7,790 | 73119 | -16% | 8946 |
| Hollywood Hills West | 723 | 744 | 15965 | -3% | 4529 |
| Hyde Park | 1977 | 2,380 | 35461 | -17% | 5575 |
| Jefferson Park | 1022 | 1224 | 25339 | -17% | 4033 |
| Koreatown | 5,062 | 5,579 | 107316 | -9% | 4717 |
| Lake Balboa | 728 | 928 | 27115 | -22% | 2685 |
| Lakeview Terrace | 370 | 379 | 13579 | -2% | 2725 |
| Larchmont | 349 | 343 | 8595 | 2% | 4061 |
| Leimert Park | 916 | 1031 | 12566 | -11% | 7290 |
| Lincoln Heights | 1222 | 1413 | 28649 | -14% | 4265 |
| Los Feliz | 1456 | 1475 | 21296 | -1% | 6837 |
| Manchester Square | 796 | 963 | 11516 | -17% | 6912 |
| Mar Vista | 1106 | 1122 | 37833 | -1% | 2923 |
| Mid-City | 2,412 | 2,809 | 51962 | -14% | 4642 |
| Mid-Wilshire | 1980 | 2,373 | 42682 | -17% | 4639 |
| Mission Hills | 780 | 871 | 18747 | -10% | 4161 |
| Montecito Heights | 484 | 533 | 17724 | -9% | 2731 |
| Mount Washington | 251 | 334 | 14201 | -25% | 1767 |
| North Hills | 2,082 | 2,419 | 62414 | -14% | 3336 |
| North Hollywood | 4,193 | 4,601 | 81849 | -9% | 5123 |
| Northridge | 2,643 | 3,126 | 67555 | -15% | 3912 |
| Pacific Palisades | 685 | 627 | 24990 | 9% | 2741 |
| Pacoima | 2,653 | 2,947 | 76726 | -10% | 3458 |
| Palms | 1558 | 1552 | 42746 | 0% | 3645 |
| Panorama City | 2,498 | 2,902 | 70212 | -14% | 3558 |
| Pico-Robertson | 822 | 784 | 18307 | 5% | 4490 |
| Pico-Union | 2,465 | 2,607 | 42187 | -5% | 5843 |
| Playa Del Rey | 443 | 434 | 11434 | 2% | 3874 |
| Playa Vista | 573 | 541 | 11126 | 6% | 5150 |
| Porter Ranch | 426 | 609 | 26040 | -30% | 1636 |
| Rancho Park | 223 | 206 | 5531 | 8% | 4032 |
| Reseda | 2,569 | 2,693 | 71569 | -5% | 3590 |
| San Pedro | 3,457 | 3,584 | 80601 | -4% | 4289 |
| Sawtelle | 2,120 | 2,254 | 42223 | -6% | 5021 |
| Shadow Hills | 385 | 463 | 12999 | -17% | 2962 |
| Sherman Oaks | 2,677 | 3,018 | 71575 | -11% | 3740 |
| Silver Lake | 1310 | 1590 | 31189 | -18% | 4200 |
| South Park | 1764 | 2,043 | 33339 | -14% | 5291 |
| Studio City | 1976 | 2,245 | 39851 | -12% | 4958 |
| Sun Valley | 2,992 | 3,584 | 71743 | -17% | 4170 |
| Sunland | 522 | 509 | 14614 | 3% | 3572 |
| Sylmar | 2,421 | 2,546 | 80327 | -5% | 3014 |
| Tarzana | 1440 | 1715 | 37739 | -16% | 3816 |
| Toluca Lake | 408 | 383 | 9192 | 7% | 4439 |
| Tujunga | 847 | 748 | 27328 | 13% | 3099 |
| University Park | 1168 | 1889 | 24170 | -38% | 4832 |
| Valley Glen | 2,330 | 2,764 | 58495 | -16% | 3983 |
| Valley Village | 937 | 1095 | 25746 | -14% | 3639 |
| Van Nuys | 5,490 | 6,148 | 111635 | -11% | 4918 |
| Venice | 3,154 | 3,148 | 34048 | 0% | 9263 |
| Vermont Knolls | 1823 | 2,035 | 24031 | -10% | 7586 |
| Vermont Slauson | 2,440 | 2,495 | 21634 | -2% | 11279 |
| Vermont Square | 3,058 | 3,346 | 26836 | -9% | 11395 |
| Vermont Vista | 1814 | 2021 | 49385 | -10% | 3673 |
| Watts | 2,318 | 2,733 | 44939 | -15% | 5158 |
| West Adams | 1078 | 1312 | 21328 | -18% | 5054 |
| West Hills | 1137 | 1387 | 39299 | -18% | 2893 |
| West Los Angeles | 763 | 605 | 12888 | 26% | 5920 |
| Westchester | 2,969 | 3,774 | 41193 | -21% | 7208 |
| Westlake | 5,931 | 6,445 | 107760 | -8% | 5504 |
| Westwood | 1307 | 1405 | 53050 | -7% | 2464 |
| Wilmington | 2,886 | 2,770 | 58161 | 4% | 4962 |
| Windsor Square | 293 | 324 | 6694 | -10% | 4377 |
| Winnetka | 1583 | 1817 | 53895 | -13% | 2937 |
| Woodland Hills | 2,748 | 3,199 | 67139 | -14% | 4093 |
How we did it: We examined publicly available LAPD data on reported crimes in the City of Los Angeles. For neighborhood boundaries, we rely on the borders defined by the Los Angeles Times. Learn more about our data here.
LAPD data only reflects crimes that are reported to the department, not how many crimes actually occurred. In making our calculations, we rely on the data the LAPD makes publicly available.
The LAPD periodically updates past crime reports with new information, leading the department to recategorize past reports. Additionally, revised reports do not always automatically become part of the public database. But, we will keep monitoring hate crimes in the City of Los Angeles.
Want to know how your neighborhood fares? Or simply just interested in our data? Email us at askus@xtown.la.


