

More bicycles are on the road, and fewer are being stolen


In the months after the pandemic hit, it became almost impossible to buy a bicycle. With most gyms closed, and people looking to get exercise close to home, bike shops sold out their inventory almost instantly, leading to long waits for those hoping to purchase a two-wheeler.
In Los Angeles there was a less noticeable pandemic trend: bike thefts fell. The 2,011 bicycles reported stolen last year represents a 16% decrease from the 2,412 that went missing in 2019.
The decrease surpasses the approximately 11% overall crime drop in the city last year. It also comes as there have been more cyclists on the road and fewer cars; Los Angeles even marked a record low for bicycle-vehicle collisions in September.
Brenda Yancor, community engagement manager of the Los Angeles County Bicycle Coalition, expressed surprise at the decline in bike thefts given the overall increase in cycling. She suspects that the decrease stems from people not leaving their bikes outside and unattended while at work, shopping or dining at restaurants.
This drop actually began before the pandemic, as the 150 thefts reported in January 2020 marked a 27% decrease from the same period the previous year. Yet the trend never ceased, and every single month in 2020 brought a lower bike theft total than its counterpart in 2019. In fact, only twice last year was there a month with 200 or more bicycles stolen. In 2020, thefts crossed that plateau seven times.
Bike thefts by month, 2020 and 2019
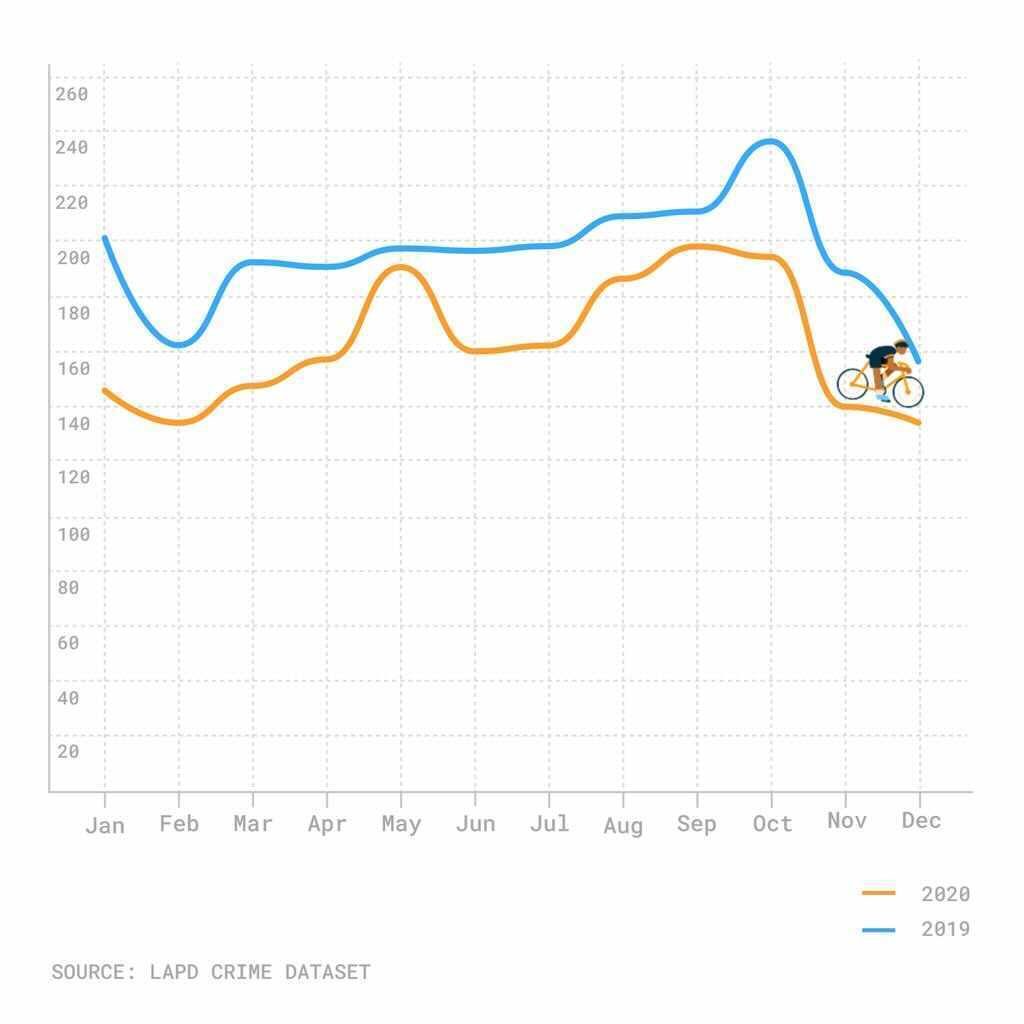
There was a steep decline in bike thefts during the last two months of 2020, though there was also a sharp fall at the end of 2019. In December 2020, 140 bikes were reported stolen, a 13% decrease from the same month the previous year.
Numbers tumble in University Park
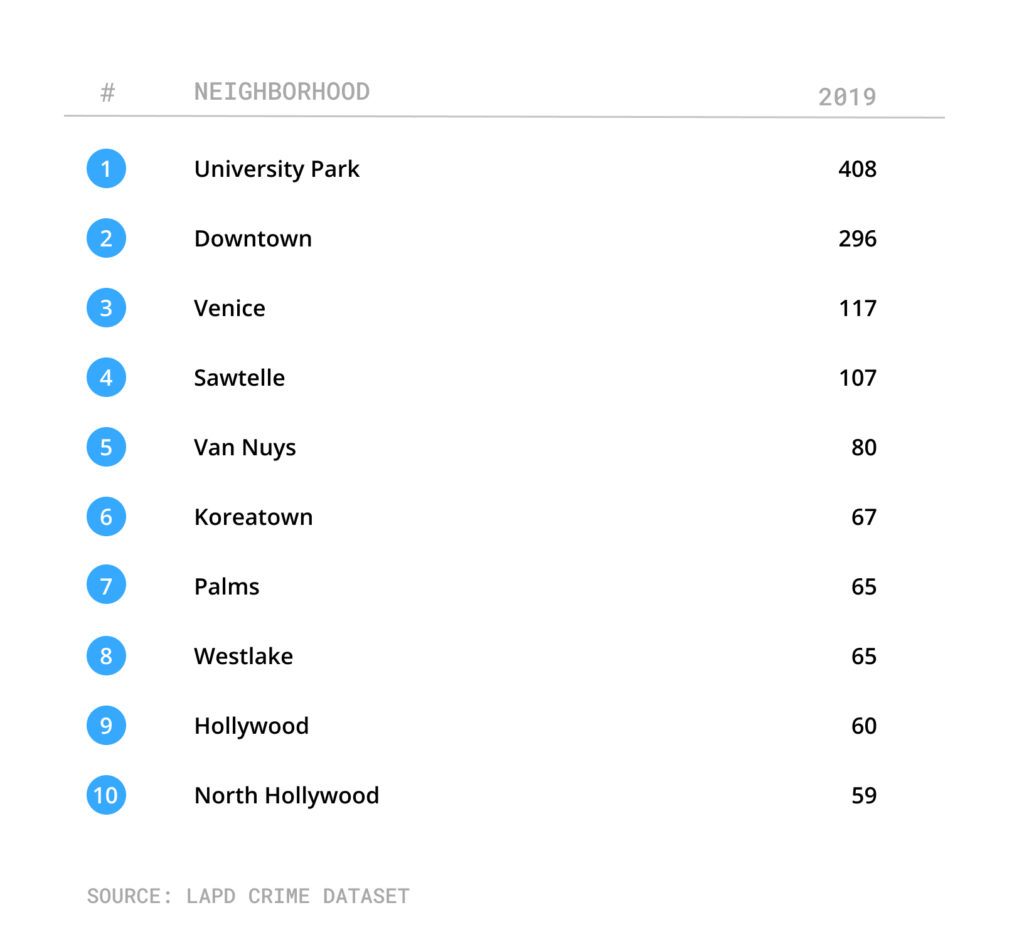
The starkest difference occurred in University Park. The neighborhood that includes the University of Southern California saw 408 bikes stolen in 2019, but just 142 last year. That coincides with tens of thousands of students not being on campus due to the pandemic.
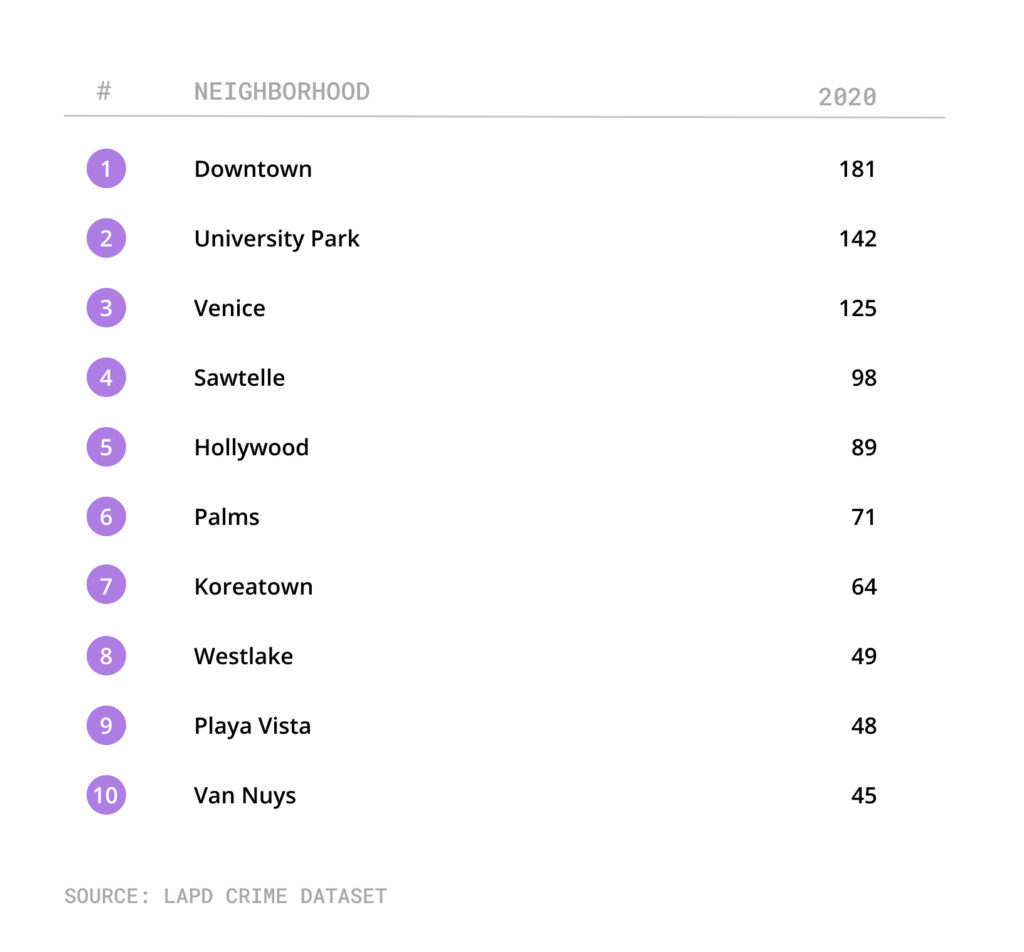
Downtown recorded the highest number of thefts of any Los Angeles neighborhood last year, though the 181 two-wheelers taken was down from 296 the year before.
Neighborhoods with most reported bike thefts in 2020
Neighborhoods with most reported bike thefts in 2019
Some neighborhoods actually saw increases. Venice experienced a 6.9% rise, from 117 bikes stolen in 2019 to 125 last year. Palms recorded a 9.2% boost, from 65 to 71.
However, the greatest increase occurred in Hollywood, where the 89 bike thefts represented a 48% increase over the 60 stolen in 2019. Yancor said the rise in the community could be attributed to multiple factors, including a greater number of inexperienced cyclists who may not know how to properly lock their bike. General pedestrian traffic could also play a role.
“Maybe it’s because there’s fewer people out on the street, fewer people going out to all of these different places,” said Yancor. “So there’s more opportunity to take bikes without a lot of people looking.”
An increase in reports in neighborhoods like Venice and Palms could also be attributed to a spike in smart-bike thefts on the Westside that started during the pandemic; from April to October last year, 264 of these bikes went missing. According to Metro spokesperson Dave Sotero, this was likely the work of an organized ring specifically targeting these bicycles.
In the first two months of 2021, there have been 162 reported bike thefts in Los Angeles. This marks a significant decrease from the 288 during the same time last year and the 375 in 2019.
How We Did It: We examined publicly available crime data from the Los Angeles Police Department beginning in 2010. Learn more about our data here.
LAPD data only reflects crimes that are reported to the department, not how many crimes actually occurred. In making our calculations, we rely on the data the LAPD makes publicly available. LAPD may update past crime reports with new information, or recategorize past reports. Those revised reports do not always automatically become part of the public database.
Want to know how your neighborhood fares? Or simply just interested in our data? Email us at askus@xtown.la.


