

Tale of two cities: Vaccination rates across LA


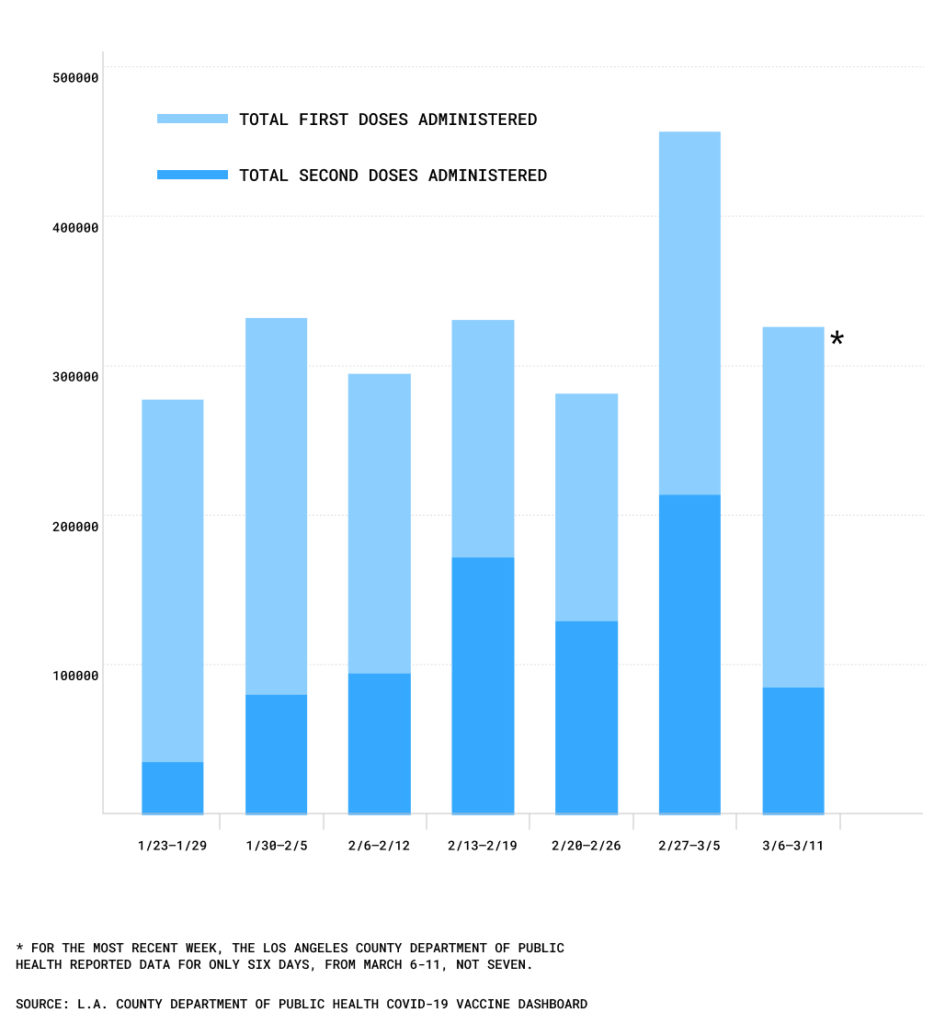
The coronavirus slammed into Los Angeles in March 2020, and on Dec. 14, the first vaccine dose was administered to a county resident. By March 10, according to the County Department of Public Health, more than 2.7 million doses had gone into local arms, with nearly 900,000 being second doses.
The progress has been inconsistent, a result of uneven supply chains, and in some cases the need to save the scarce quantity of vaccines available for people who need a timely second dose. During the week of Feb. 19-25, about 275,000 doses were administered across the county; the apex came the following week, when 457,000 doses were dispensed.
Vaccines administered by week, first and second doses
But just as COVID-19 has had a disproportionate impact on certain low-income neighborhoods and communities of color, there are startling discrepancies in where the vaccines are going.
Wealthy communities have tended to see the greatest vaccine penetration. In Cheviot Hills, 37.1% of residents have received at least one dose, the highest level in the county, according to the Department of Public Health. Bel Air has seen 34.3% of the population vaccinated. Other high-wealth Los Angeles County neighborhoods or cities with an inoculation rate north of 30% include Century City (34.2%) Beverly Hills (32%) and Pacific Palisades (30.5%)
Meanwhile, numerous lower-income neighborhoods have seen fewer than one in 10 residents receive a vaccine dose. The rate is 8.65% in Exposition Park, 8% in Compton and 7.3% in Watts. The level dips below 7% in South Los Angeles neighborhoods such as Vermont Vista (6.8%) and Florence (6.6%).
Neighborhoods with the highest and lowest vaccination levels

(See the table at the bottom of this story to find the vaccination rate in your neighborhood.)
Different rates for different ethnic groups
Latinos, who comprise 47.6% of the county population and 52.4% of COVID-19-related deaths, have received 24.9% of the vaccines, according to the County Department of Public Health. Though 8% of the county is Black, just 5.5% of Black residents have received at least one dose.
Local and state leaders have sought to address the inequity of distribution by ramping up mobile clinics and other programs to bring vaccines to lower-income neighborhoods.

Approximately 70% of the more than 22,000 people who have died of COVID-19 are over the age of 64. That population was prioritized early in the vaccination rollout, and according to data from the County Department of Public Health, 59.3% of the approximately 1.4 million county residents over 65 years have been vaccinated. Nearly one-quarter of those who have received at least one dose are 30 to 49.
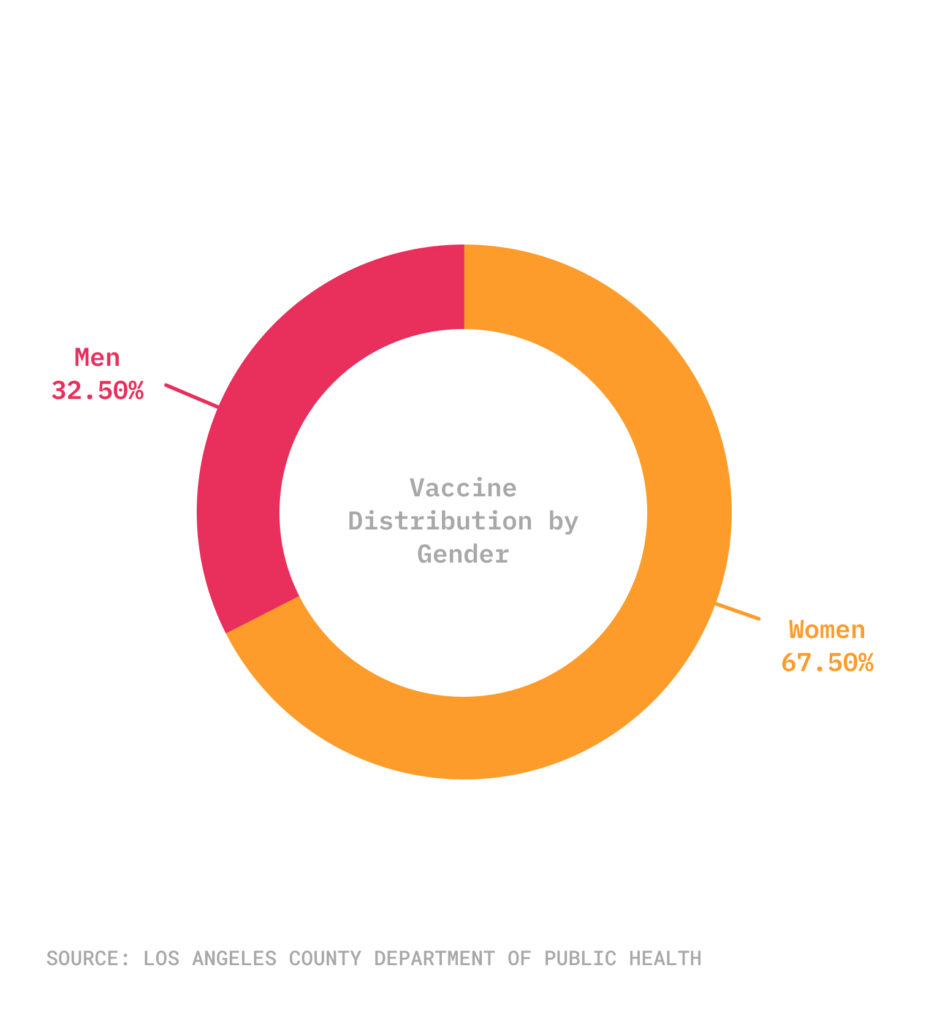
One surprising discrepancy concerns gender. Although women slightly outnumber men in Los Angeles County, and men account for 58.8% of COVID-related deaths, women have received approximately 1.16 million doses, more than twice the 556,000 men have received.
Three different vaccines are currently being administered: the Pfizer and Moderna vaccines, which require two doses, given three to four weeks apart, and the Johnson & Johnson version, which takes only a single dose. On Monday, the county expanded the list of those eligible for vaccination, opening it to people ages 16 to 64 with underlying health conditions that exacerbate the risk of COVID-19.
Compare the rate of doses received in your community against others with this sortable chart.
| Neighborhood/City | Vaccinations | Population |
% of doses per community
|
| Cheviot Hills | 2645 | 7134 | 37.08 |
| Bel Air | 2390 | 6968 | 34.3 |
| Century City | 3557 | 10382 | 34.26 |
| Bradbury | 407 | 1205 | 33.78 |
| Beverly Crest | 3243 | 9960 | 32.56 |
| Beverly Hills | 9498 | 29659 | 32.02 |
| Sepulveda Basin | 11223 | 36474 | 30.77 |
| Encino | 11223 | 36474 | 30.77 |
| Rolling Hills | 868 | 2843 | 30.53 |
| Pacific Palisades | 6135 | 20102 | 30.52 |
| Rolling Hills Estates | 2323 | 7640 | 30.41 |
| Rancho Park | 1482 | 4981 | 29.75 |
| Palos Verdes Estates | 3413 | 11696 | 29.18 |
| Brentwood | 8158 | 28379 | 28.75 |
| San Marino | 3163 | 11148 | 28.37 |
| La Cañada Flintridge | 5030 | 17805 | 28.25 |
| Rancho Palos Verdes | 10162 | 36530 | 27.82 |
| Porter Ranch | 8172 | 29811 | 27.41 |
| Sierra Madre | 2516 | 9255 | 27.19 |
| Cerritos | 11892 | 44058 | 26.99 |
| Calabasas | 5352 | 19988 | 26.78 |
| Beverlywood | 2556 | 9756 | 26.2 |
| Tarzana | 6523 | 24965 | 26.13 |
| Ladera Heights | 1565 | 6058 | 25.83 |
| San Pasqual | 410 | 1605 | 25.55 |
| Hidden Hills | 414 | 1631 | 25.38 |
| Vernon | 56 | 222 | 25.23 |
| Manhattan Beach | 6958 | 28733 | 24.22 |
| South Pasadena | 5088 | 21506 | 23.66 |
| East Pasadena | 1479 | 6254 | 23.65 |
| Playa Vista | 2203 | 9359 | 23.54 |
| West Hills | 8162 | 34696 | 23.52 |
| Chatsworth Reservoir | 8162 | 34696 | 23.52 |
| Windsor Square | 3140 | 13402 | 23.43 |
| Hancock Park | 3140 | 13402 | 23.43 |
| Carthay | 4802 | 20691 | 23.21 |
| Beverly Grove | 4802 | 20691 | 23.21 |
| Woodland Hills | 12954 | 55829 | 23.2 |
| Claremont | 7711 | 33376 | 23.1 |
| Walnut | 6094 | 26458 | 23.03 |
| West San Dimas | 70 | 305 | 22.95 |
| Culver City | 7445 | 32840 | 22.67 |
| Pasadena | 26094 | 117771 | 22.16 |
| Duarte | 3886 | 17654 | 22.01 |
| Chatsworth | 7116 | 32505 | 21.89 |
| Agoura Hills | 3807 | 17447 | 21.82 |
| West Carson | 3923 | 18052 | 21.73 |
| Altadena | 7714 | 35764 | 21.57 |
| Santa Monica | 17154 | 80251 | 21.38 |
| Granada Hills | 10129 | 47949 | 21.12 |
| Carson | 15806 | 75272 | 21 |
| La Verne | 5849 | 27927 | 20.94 |
| Torrance | 25356 | 121277 | 20.91 |
| North El Monte | 10380 | 49666 | 20.9 |
| Arcadia | 10380 | 49666 | 20.9 |
| Artesia | 2890 | 13877 | 20.83 |
| San Dimas | 6031 | 29065 | 20.75 |
| Pico Robertson | 1822 | 8801 | 20.7 |
| Glendora | 8818 | 42883 | 20.56 |
| La Crescenta Montrose | 3353 | 16603 | 20.2 |
| Studio City | 3750 | 18611 | 20.15 |
| Sherman Oaks | 14174 | 71049 | 19.95 |
| Monterey Park | 10260 | 51545 | 19.9 |
| South San Gabriel | 1465 | 7371 | 19.88 |
| Westwood | 9565 | 48461 | 19.74 |
| View Park Windsor Hills | 1904 | 9812 | 19.4 |
| Alondra Park | 1274 | 6573 | 19.38 |
| Diamond Bar | 9412 | 48623 | 19.36 |
| Eagle Rock | 6241 | 32330 | 19.3 |
| Playa Del Rey | 515 | 2671 | 19.28 |
| Temple City | 5895 | 30661 | 19.23 |
| Signal Hill | 1735 | 9046 | 19.18 |
| North Whittier | 2044 | 10698 | 19.11 |
| Mar Vista | 6447 | 33940 | 19 |
| East San Gabriel | 3695 | 19550 | 18.9 |
| Malibu | 2009 | 10697 | 18.78 |
| Elysian Park | 891 | 4748 | 18.77 |
| Alhambra | 13321 | 71313 | 18.68 |
| Redondo Beach | 10126 | 54241 | 18.67 |
| Mayflower Village | 2397 | 12863 | 18.63 |
| Sawtelle | 6022 | 32337 | 18.62 |
| West Los Angeles | 6022 | 32337 | 18.62 |
| West Covina | 15976 | 86215 | 18.53 |
| Topanga | 2912 | 15724 | 18.52 |
| Unincorporated Santa Monica Mountains | 2912 | 15724 | 18.52 |
| Atwater Village | 2319 | 12520 | 18.52 |
| Castaic Canyons | 959 | 5198 | 18.45 |
| Green Valley | 959 | 5198 | 18.45 |
| Hermosa Beach | 3022 | 16389 | 18.44 |
| Stevenson Ranch | 3056 | 16712 | 18.29 |
| Santa Clarita | 31065 | 170660 | 18.2 |
| Gardena | 8794 | 48335 | 18.19 |
| Monrovia | 5468 | 30249 | 18.08 |
| Northridge | 10548 | 58451 | 18.05 |
| Lakewood | 11627 | 64815 | 17.94 |
| Glassell Park | 4349 | 24832 | 17.51 |
| Hacienda Heights | 8155 | 46574 | 17.51 |
| Covina | 6767 | 38659 | 17.5 |
| La Mirada | 7100 | 40803 | 17.4 |
| Reseda | 10955 | 63666 | 17.21 |
| San Gabriel | 5774 | 33721 | 17.12 |
| Glendale | 29628 | 173192 | 17.11 |
| Sunland | 2888 | 17070 | 16.92 |
| Westchester | 7171 | 42616 | 16.83 |
| Mission Hills | 3145 | 18827 | 16.7 |
| Lomita | 2743 | 16469 | 16.66 |
| Rowland Heights | 7055 | 42449 | 16.62 |
| South Diamond Bar | 7055 | 42449 | 16.62 |
| Unincorporated Santa Susana Mountains | 254 | 1537 | 16.53 |
| Long Beach | 61200 | 370564 | 16.52 |
| Shadow Hills | 621 | 3772 | 16.46 |
| Marina Del Rey | 1355 | 8322 | 16.28 |
| Valley Village | 3283 | 20238 | 16.22 |
| Del Rey | 3906 | 24080 | 16.22 |
| El Segundo | 2263 | 14019 | 16.14 |
| Winnetka | 6416 | 40246 | 15.94 |
| Burbank | 13905 | 87289 | 15.93 |
| Cypress Park | 3016 | 18940 | 15.92 |
| Mount Washington | 3016 | 18940 | 15.92 |
| Silver Lake | 5849 | 36752 | 15.91 |
| Whittier | 10831 | 68364 | 15.84 |
| Toluca Lake | 1440 | 9110 | 15.81 |
| Tujunga | 3598 | 22814 | 15.77 |
| Venice | 5042 | 32027 | 15.74 |
| Hollywood Hills | 3968 | 25398 | 15.62 |
| Hollywood Hills West | 3968 | 25398 | 15.62 |
| Downey | 13586 | 88272 | 15.39 |
| Pico Rivera | 7627 | 49558 | 15.39 |
| Harbor City | 3706 | 24334 | 15.23 |
| Rosemead | 6763 | 44628 | 15.15 |
| Mid-Wilshire | 5924 | 39317 | 15.07 |
| El Sereno | 5277 | 35026 | 15.07 |
| Hansen Dam | 1497 | 10043 | 14.91 |
| Lake View Terrace | 1497 | 10043 | 14.91 |
| Del Aire | 1222 | 8212 | 14.88 |
| Montebello | 7421 | 49946 | 14.86 |
| Westlake Village | 1071 | 7234 | 14.81 |
| Elysian Valley | 1190 | 8038 | 14.8 |
| Arleta | 3884 | 26334 | 14.75 |
| Irwindale | 178 | 1212 | 14.69 |
| San Pedro | 9078 | 62104 | 14.62 |
| Santa Fe Springs | 2115 | 14475 | 14.61 |
| West Hollywood | 4975 | 34195 | 14.55 |
| North Hills | 6736 | 46307 | 14.55 |
| East La Mirada | 1226 | 8503 | 14.42 |
| Charter Oak | 1533 | 10639 | 14.41 |
| Highland Park | 5307 | 36926 | 14.37 |
| Rancho Dominguez | 321 | 2239 | 14.34 |
| Downtown | 9524 | 66900 | 14.24 |
| Sylmar | 8802 | 61824 | 14.24 |
| Norwalk | 11638 | 82126 | 14.17 |
| Fairfax | 8747 | 62874 | 13.91 |
| Larchmont | 8747 | 62874 | 13.91 |
| Palms | 5036 | 36258 | 13.89 |
| West Puente Valley | 2616 | 18936 | 13.81 |
| West Whittier Los Nietos | 2871 | 20804 | 13.8 |
| Vincent | 2081 | 15151 | 13.74 |
| Ramona | 2081 | 15151 | 13.74 |
| Commerce | 1335 | 9779 | 13.65 |
| Valinda | 2435 | 17856 | 13.64 |
| Gramercy Park | 1177 | 8657 | 13.6 |
| Tujunga Canyons | 82 | 612 | 13.4 |
| Baldwin Park | 7778 | 58253 | 13.35 |
| Los Feliz | 3608 | 27148 | 13.29 |
| Griffith Park | 3608 | 27148 | 13.29 |
| Panorama City | 7345 | 55481 | 13.24 |
| Bellflower | 7829 | 59564 | 13.14 |
| Lake Balboa | 4252 | 32423 | 13.11 |
| Sun Valley | 5159 | 39885 | 12.93 |
| Agua Dulce | 467 | 3648 | 12.8 |
| Lincoln Heights | 3165 | 24798 | 12.76 |
| Montecito Heights | 3165 | 24798 | 12.76 |
| Azusa | 5014 | 39805 | 12.6 |
| Leimert Park | 1543 | 12337 | 12.51 |
| West Adams | 5426 | 43682 | 12.42 |
| Baldwin Hills Crenshaw | 2965 | 23952 | 12.38 |
| Mid City | 6269 | 51281 | 12.22 |
| Canoga Park | 6056 | 49538 | 12.22 |
| Valley Glen | 2901 | 23760 | 12.21 |
| El Monte | 10837 | 88826 | 12.2 |
| South Whittier | 5444 | 45651 | 11.93 |
| San Fernando | 2224 | 18698 | 11.89 |
| Pomona | 13699 | 115688 | 11.84 |
| Citrus | 1371 | 11706 | 11.71 |
| Harbor Gateway | 3795 | 32717 | 11.6 |
| Ridge Route | 2535 | 22023 | 11.51 |
| Hasley Canyon | 2535 | 22023 | 11.51 |
| Castaic | 2535 | 22023 | 11.51 |
| Boyle Heights | 7200 | 62635 | 11.5 |
| La Puente | 3562 | 31049 | 11.47 |
| East Los Angeles | 10338 | 90890 | 11.37 |
| Walnut Park | 1355 | 12006 | 11.29 |
| Angeles Crest | 247 | 2189 | 11.28 |
| Northwest Palmdale | 368 | 3272 | 11.25 |
| Hyde Park | 2796 | 24847 | 11.25 |
| Inglewood | 9689 | 86385 | 11.22 |
| Quartz Hill | 1169 | 10420 | 11.22 |
| East Hollywood | 3405 | 30381 | 11.21 |
| Hawthorne | 7579 | 67636 | 11.21 |
| Manchester Square | 751 | 6716 | 11.18 |
| Pacoima | 6112 | 54673 | 11.18 |
| Pico Union | 3496 | 31571 | 11.07 |
| Jefferson Park | 664 | 6031 | 11.01 |
| South El Monte | 1751 | 15956 | 10.97 |
| Koreatown | 11399 | 104010 | 10.96 |
| Echo Park | 4896 | 44726 | 10.95 |
| South San Jose Hills | 1654 | 15181 | 10.9 |
| Chinatown | 782 | 7292 | 10.72 |
| Avocado Heights | 739 | 6978 | 10.59 |
| Van Nuys | 7381 | 69836 | 10.57 |
| South Gate | 7435 | 71455 | 10.41 |
| Arlington Heights | 665 | 6416 | 10.36 |
| Val Verde | 271 | 2619 | 10.35 |
| La Habra Heights | 554 | 5374 | 10.31 |
| Acton | 698 | 6783 | 10.29 |
| Harvard Heights | 1399 | 13648 | 10.25 |
| North Hollywood | 12296 | 120473 | 10.21 |
| Veterans Administration | 88 | 868 | 10.14 |
| Leona Valley | 156 | 1547 | 10.08 |
| Avalon | 300 | 3000 | 10 |
| Lawndale | 2537 | 25528 | 9.94 |
| Westlake | 5678 | 57264 | 9.92 |
| Hollywood | 5959 | 60385 | 9.87 |
| Lancaster | 11833 | 120142 | 9.85 |
| Lynwood | 5067 | 51504 | 9.84 |
| Paramount | 3991 | 40656 | 9.82 |
| Adams-Normandie | 606 | 6300 | 9.62 |
| Wilmington | 3910 | 40636 | 9.62 |
| West Compton | 442 | 4603 | 9.6 |
| Desert View Highlands | 184 | 1943 | 9.47 |
| Palmdale | 11148 | 117887 | 9.46 |
| Huntington Park | 4012 | 43564 | 9.21 |
| Harvard Park | 2570 | 27989 | 9.18 |
| Vermont Slauson | 2570 | 27989 | 9.18 |
| Chesterfield Square | 2570 | 27989 | 9.18 |
| Hawaiian Gardens | 970 | 10728 | 9.04 |
| Maywood | 1815 | 20131 | 9.02 |
| Vermont Square | 4022 | 44940 | 8.95 |
| Unincorporated Catalina Island | 22 | 247 | 8.91 |
| Lopez Kagel Canyons | 94 | 1057 | 8.89 |
| Bell Gardens | 2735 | 30840 | 8.87 |
| Willowbrook | 2541 | 28951 | 8.78 |
| Bell | 2332 | 26746 | 8.72 |
| Exposition Park | 3033 | 35075 | 8.65 |
| Vermont Knolls | 1083 | 12638 | 8.57 |
| Southeast Antelope Valley | 430 | 5105 | 8.42 |
| Westmont | 2646 | 31407 | 8.42 |
| Compton | 5741 | 71836 | 7.99 |
| East Compton | 828 | 10660 | 7.77 |
| Northwest Antelope Valley | 254 | 3396 | 7.48 |
| Lennox | 1190 | 16313 | 7.29 |
| Watts | 2060 | 28307 | 7.28 |
| Cudahy | 1224 | 17477 | 7 |
| Northeast Antelope Valley | 424 | 6065 | 6.99 |
| Historic South-Central | 1874 | 27297 | 6.87 |
| Green Meadows | 2629 | 38491 | 6.83 |
| Broadway Manchester | 2629 | 38491 | 6.83 |
| Vermont Vista | 2354 | 34730 | 6.78 |
| South Park | 1765 | 26088 | 6.77 |
| Florence Firestone | 3075 | 45509 | 6.76 |
| Florence | 2153 | 32670 | 6.59 |
| Central Alameda | 2332 | 35744 | 6.52 |
| University Park | 1524 | 23588 | 6.46 |
| Sun Village | 282 | 4525 | 6.23 |
| Lake Los Angeles | 565 | 9635 | 5.86 |
How we did it: We examined data on coronavirus vaccinations and the City of Los Angeles’ COVID-19 response from the Los Angeles County Department of Public Health and data documents produced by the office of Mayor Eric Garcetti. In some cases information may have changed from what was originally published.
Interested in our data? Check out the Crosstown coronavirus interactive map or email us at askus@xtown.la.


