

As coronavirus cases fall, some neighborhoods see surprising spikes


Los Angeles County continues to hit milestones in the battle against COVID-19. Nearly 8 million vaccine doses had been administered through April 28, according to the County Department of Public Health, and on Sunday and Monday health officials reported no new deaths. More businesses are coming online as the county reaches the state’s yellow reopening tier.
The number of vaccinations of residents in low-income communities of color continues to lag behind wealthier neighborhoods. However, recently some of the steepest drops in new case counts have occurred in high-needs areas that previously were disproportionately impacted by the coronavirus. And some well-off neighborhoods actually saw case loads rise.
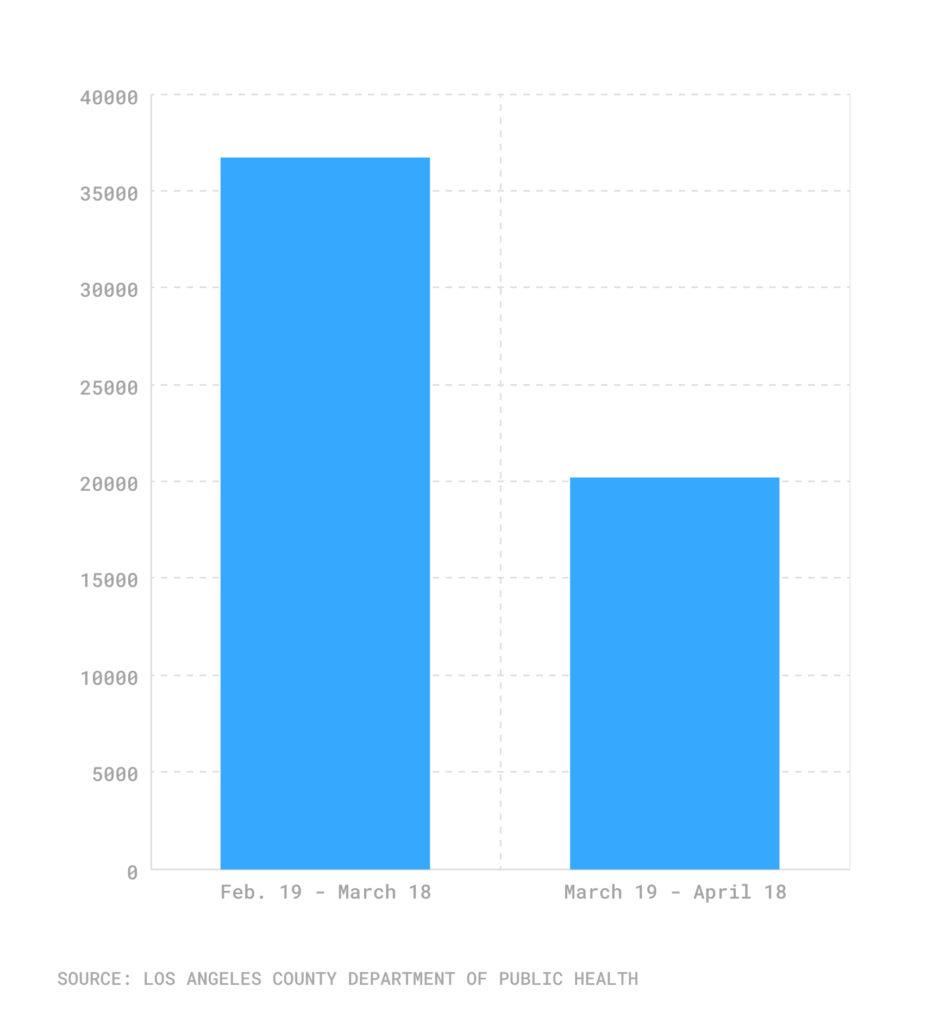
During the period between Feb. 19 and March 18, Los Angeles County recorded a total of 36,715 new infections. In the following month, from March 19-April 18, the number of coronavirus infections fell 45% to 20,178, according to publicly available data from the Department of Public Health.
New COVID-19 case counts in Los Angeles, Feb. 19-April 18
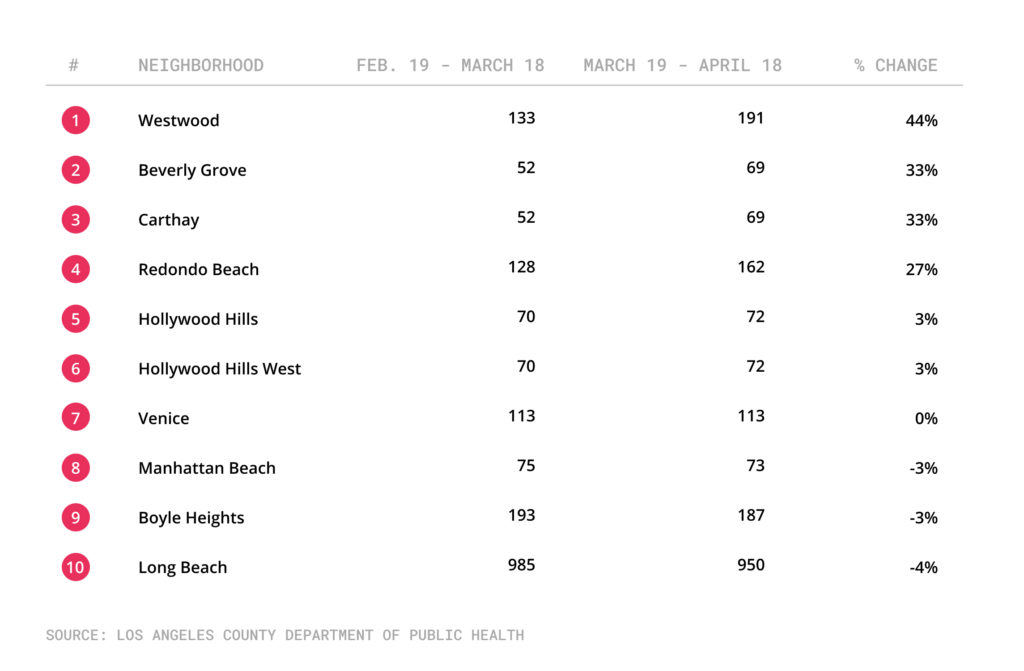
As usual, there are discrepancies by community. Of the 180 neighborhoods that recorded more than 50 new cases in the first period, nearly a quarter saw the level of infections fall by less than 30%.
Six neighborhoods actually saw the case count climb. In Westwood, infections grew by 44%, from 133 to 191 in consecutive periods. The upper-income communities of Beverly Grove and Carthay both saw a 33% rise.
Neighborhoods with smallest declines, or growth, in new COVID cases, Feb. 19-April 18
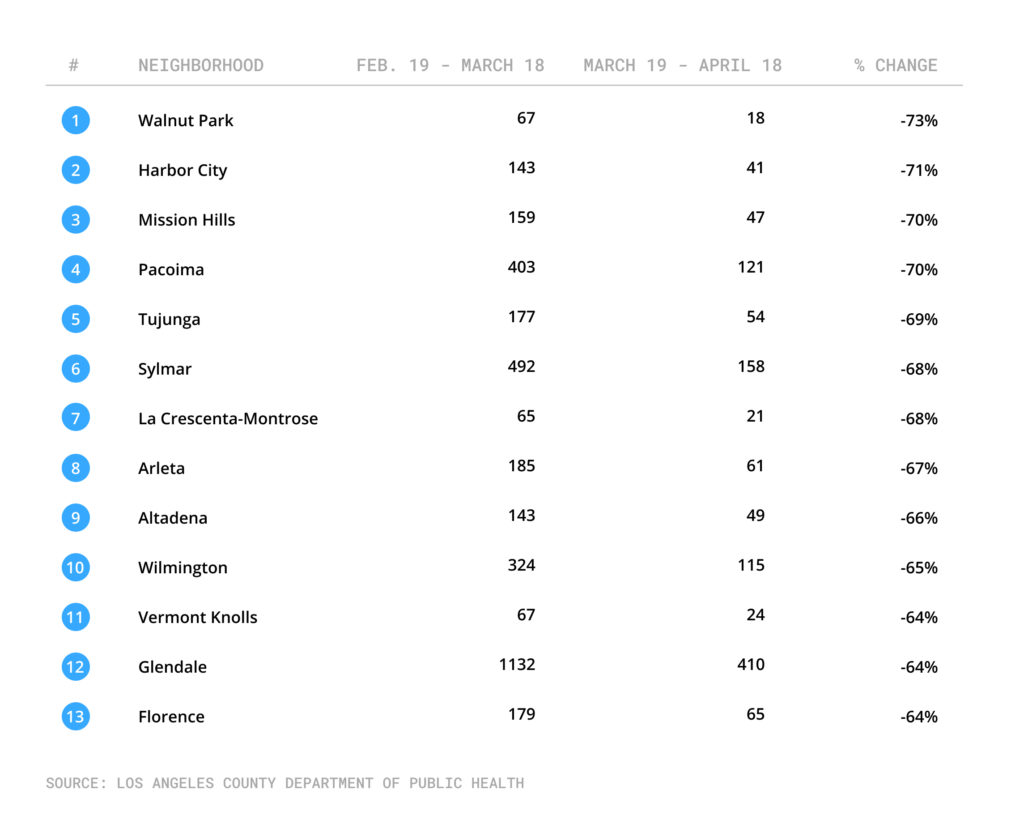
The most significant decrease in new cases occurred in the Southeast Los Angeles County neighborhood of Walnut Park; it went from 67 COVID-19 cases from Feb. 19-March 18 to just 18 in the following period. That represents a 73% drop.
Other neighborhoods that saw sharp declines include lower-income areas such as Pacoima (from 403 to 121 new cases, a fall of 70%) and Florence (from 179 to 65, a 64% decrease).
The discrepancy is likely the result of numerous elements. One contributing factor may be that lower-income areas previously were being hit especially hard by COVID-19, so a drop from inflated figures can result in a high percentage change. At the same time, a higher-income area that had a low baseline in cases may see a significant statistical rise even with an increase of only a few dozen new cases.
According to the Department of Public Health, the change also comes from shifts in access to vaccines. Elected and health officials have had more success in recent periods in distributing doses to high-needs communities. In a March 31 statement, L.A. County Public Health Director Dr. Barbara Ferrer pointed specifically to this change. The work has included more “pop-up” clinics in some of the hardest-hit neighborhoods, and two dozen schools in high-needs communities have also emerged as vaccination centers.
Neighborhoods with greatest decline in new COVID cases, Feb. 19-April 18
Focus on Florence
The numbers for the South Los Angeles neighborhood of Florence stand out in particular because it has one of the lowest vaccination rates in the county. According to the Department of Public Health, as of April 23, only 30% of Florence residents had been vaccinated. Countywide, 54% of the population has received at least one dose of a vaccine.
Some more affluent communities with higher vaccination rates have also seen new coronavirus cases rise. For example, Rancho Park, which has seen 75% of its residents receive at least one vaccine dose, saw an 82% increase in new infections in a recent four-week period. In wealthy San Marino, where 62% of residents have been inoculated, there was a 150% increase in new cases.
How we did it: We compared the total number of new cases across 270 communities in Los Angeles County that occurred during each four-week period by using publicly available data from the Los Angeles County Department of Public Health. We then calculated the percent change between the two periods. We restricted our list only to neighborhoods that recorded at least 50 cases during the first period of Feb. 19-March 18 in order not to not have low numbers throw off the percent change.
Have questions about our data, or want to know more? Write to us at askus@xtown.la.


