

As vaccinations increase, neighborhood divide endures


On Monday, the Los Angeles County Department of Public Health announced that more than 6 million doses of the coronavirus vaccine had been administered to area residents, and that some 4 million people had received at least some protection from the virus.
But despite a massive effort from state and local leaders and health officials, those shots are still not getting to the places where they are needed the most, and a disturbing level of inequity persists.
[Scroll down to see how your community ranks in vaccination rate.]
Although many lower-income communities have been disproportionately impacted by the pandemic, they tend to have lower vaccination rates than higher-income areas. A Crosstown examination of neighborhoods where at least 1,000 vaccine doses have been administered shows that in relatively affluent Cheviot Hills, 63.7% of the population has been inoculated. The rate of people receiving at least one dose through April 9 is north of 55% in other well-off communities including Rancho Park, Century City and Pacific Palisades.
Communities with the highest rate of vaccinated residents

Meanwhile, the rate was below 25% on April 9 in lower-income communities such as Compton, Historic South-Central and the South Los Angeles neighborhood of South Park.
Numerous factors contribute to the divide. Some of the communities with the highest vaccination rate have sizable numbers of senior citizens or healthcare workers, both categories that received priority access to vaccines. According to the Department of Public Health, as of April 19, 70% of L.A. County residents 65 and older have received at least one dose.
Communities with the lowest rate of vaccinated residents
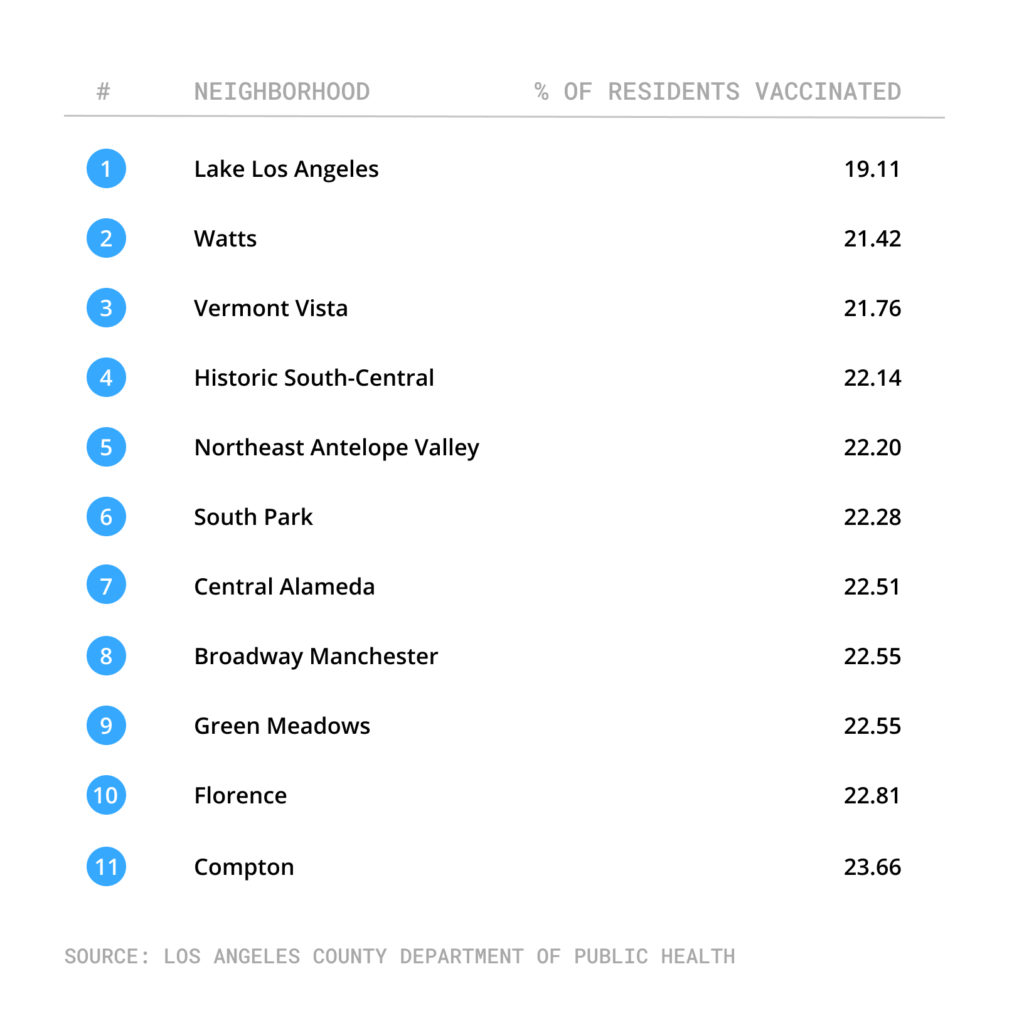
Some neighborhoods with lower rates hold a greater percentage of younger residents; only in the last few weeks have vaccinations opened to everyone in the county over the age of 16. Additionally, these areas may have more non-native English speakers, who could be harder for outreach and health workers to contact.
That is also why some of the areas now seeing the largest percentage jump are those that initially had lower rates of coverage, while communities that experienced initial high levels of inoculation may have a comparatively slower rate of increase.
From March 26-April 9, Marina Del Rey experienced a 38.1% increase in vaccinations, according to Department of Public Health data, the highest of any local neighborhood. The second-highest jump was the 34.3% in Venice. At the other end of the spectrum, Castaic Canyons, Green Valley and Ladera Heights all saw a less-than 12% increase within the same two-week period.
New tactics
There are numerous efforts underway to improve levels in neighborhoods with lower vaccination rates. The Los Angeles Unified School District has opened 25 school-based vaccination centers for families in high-needs neighborhoods where people may lack cars or have trouble reaching sites. On April 16, the Department of Public Health said that 73% of the expected 362,000 doses in the coming week would go to sites in the most vulnerable communities.
There have also been pop-up clinics where no appointment is necessary, including one that appeared this week on Eagle Rock Boulevard in Glassell Park (it runs through Saturday).
A walk-up vaccination clinic in Glassell Park

The pace of vaccinations occurs as Los Angeles has avoided the surge in cases now happening in Michigan and some other places across the country. Local levels continue to be the lowest since early in the pandemic, with COVID-19 hospitalizations now hovering around 500, down from more than 8,000 at the peak in the winter.
“We in Los Angeles are in a good place right now,” Dr. Barbara Ferrer, the Director of Public Health, said in a prepared statement on Monday. “We have an opportunity to chart a different course from the one we’re seeing play out in other parts of the country. But we can only do it together.”
Sort the table to see where your community ranks in vaccination rate
| Neighborhood/City | Percentage Vaccinated 4/9/2021 | Percentage vaccinated 3/26/2021 |
Percent change in vaccination rate
|
| Marina del Rey | 44.08 | 31.92 | 38.10% |
| Venice | 43.28 | 32.22 | 34.33% |
| Hawaiian Gardens | 28.17 | 21.09 | 33.57% |
| Westlake Village | 32.37 | 24.25 | 33.48% |
| Hollywood | 31.4 | 23.54 | 33.39% |
| Palms | 40.16 | 30.13 | 33.29% |
| Hermosa Beach | 47.08 | 35.46 | 32.77% |
| Hollywood Hills | 44.11 | 33.3 | 32.46% |
| Hollywood Hills West | 44.11 | 33.3 | 32.46% |
| West Hollywood | 44 | 33.28 | 32.21% |
| Bell | 29.62 | 22.41 | 32.17% |
| Cudahy | 25.56 | 19.34 | 32.16% |
| Griffith Park | 40.7 | 31.02 | 31.21% |
| Los Feliz | 40.7 | 31.02 | 31.21% |
| El Segundo | 44.03 | 33.6 | 31.04% |
| Toluca Lake | 43.63 | 33.32 | 30.94% |
| Silver Lake | 46.31 | 35.39 | 30.86% |
| Lynwood | 30.62 | 23.46 | 30.52% |
| Playa Vista | 55.3 | 42.39 | 30.46% |
| North Hollywood | 30 | 23.02 | 30.32% |
| Broadway Manchester | 22.55 | 17.32 | 30.20% |
| Green Meadows | 22.55 | 17.32 | 30.20% |
| Vermont Vista | 21.76 | 16.75 | 29.91% |
| Northeast Antelope Valley | 22.2 | 17.13 | 29.60% |
| Maywood | 28.99 | 22.46 | 29.07% |
| Downtown | 40.21 | 31.17 | 29.00% |
| Del-Rey | 41.29 | 32.06 | 28.79% |
| Central Alameda | 22.51 | 17.49 | 28.70% |
| Lennox | 27.16 | 21.11 | 28.66% |
| Florence | 22.81 | 17.73 | 28.65% |
| Koreatown | 31.86 | 24.78 | 28.57% |
| Sawtelle | 44 | 34.24 | 28.50% |
| West Los Angeles | 44 | 34.24 | 28.50% |
| Westchester | 43.07 | 33.55 | 28.38% |
| Bell Gardens | 27.27 | 21.25 | 28.33% |
| Echo Park | 33.61 | 26.2 | 28.28% |
| Redondo Beach | 46.2 | 36.03 | 28.23% |
| Santa Monica | 47.97 | 37.49 | 27.95% |
| Huntington Park | 28.2 | 22.05 | 27.89% |
| Mar Vista | 45.72 | 35.75 | 27.89% |
| Studio City | 48.82 | 38.2 | 27.80% |
| Watts | 21.42 | 16.82 | 27.35% |
| South Park | 22.28 | 17.55 | 26.95% |
| Lawndale | 31.21 | 24.59 | 26.92% |
| Burbank | 40.17 | 31.65 | 26.92% |
| Florence Firestone | 25.36 | 20.01 | 26.74% |
| Van Nuys | 27.54 | 21.74 | 26.68% |
| Historic South Central | 22.14 | 17.49 | 26.59% |
| Mid-Wilshire | 39.11 | 30.94 | 26.41% |
| Compton | 23.66 | 18.72 | 26.39% |
| Lake Balboa | 34.73 | 27.48 | 26.38% |
| Willowbrook | 25.83 | 20.44 | 26.37% |
| Fairfax | 37.89 | 30.04 | 26.13% |
| Larchmont | 37.89 | 30.04 | 26.13% |
| Valley Glen | 30.85 | 24.46 | 26.12% |
| East Hollywood | 29.56 | 23.44 | 26.11% |
| Valley Village | 40.67 | 32.27 | 26.03% |
| Rosemead | 43.68 | 34.66 | 26.02% |
| Pacoima | 28.44 | 22.61 | 25.79% |
| Atwater Village | 46.78 | 37.2 | 25.75% |
| Canoga Park | 31.09 | 24.73 | 25.72% |
| Lincoln Heights | 36.42 | 28.99 | 25.63% |
| Montecito Heights | 36.42 | 28.99 | 25.63% |
| South Gate | 32.57 | 25.93 | 25.61% |
| University Park | 25.15 | 20.04 | 25.50% |
| Arlington Heights | 31.31 | 24.95 | 25.49% |
| Del-Aire | 41.8 | 33.33 | 25.41% |
| Mid-City | 35.4 | 28.24 | 25.35% |
| Culver City | 52.67 | 42.08 | 25.17% |
| Highland Park | 39.13 | 31.27 | 25.14% |
| Sherman Oaks | 46.56 | 37.23 | 25.06% |
| San Fernando | 32.43 | 25.95 | 24.97% |
| Harbor Gateway | 29.76 | 23.83 | 24.88% |
| East Compton | 24.88 | 19.95 | 24.71% |
| Elysian Valley | 40.96 | 32.88 | 24.57% |
| Westlake | 25.21 | 20.25 | 24.49% |
| San Gabriel | 45.42 | 36.5 | 24.44% |
| Sun Valley | 32.09 | 25.81 | 24.33% |
| Walnut Park | 32.53 | 26.17 | 24.30% |
| Palmdale | 28.63 | 23.06 | 24.15% |
| Chinatown | 36.38 | 29.32 | 24.08% |
| La Crescenta Montrose | 45.16 | 36.47 | 23.83% |
| Topanga | 39.63 | 32.01 | 23.81% |
| Chesterfield Square | 27.73 | 22.4 | 23.79% |
| Harvard Park | 27.73 | 22.4 | 23.79% |
| Vermont Slauson | 27.73 | 22.4 | 23.79% |
| Manhattan Beach | 51.79 | 41.84 | 23.78% |
| Paramount | 27.78 | 22.46 | 23.69% |
| Cypress Park | 40.97 | 33.16 | 23.55% |
| Mount Washington | 40.97 | 33.16 | 23.55% |
| Commerce | 38.66 | 31.32 | 23.44% |
| Harvard Heights | 28.46 | 23.07 | 23.36% |
| Exposition Park | 27.46 | 22.26 | 23.36% |
| Citrus | 32.12 | 26.09 | 23.11% |
| Hawthorne | 30.6 | 24.86 | 23.09% |
| Wilmington | 26.47 | 21.52 | 23.00% |
| El Monte | 34.62 | 28.15 | 22.98% |
| Shadow Hills | 36.44 | 29.64 | 22.94% |
| Westmont | 24.14 | 19.65 | 22.85% |
| Vermont Knolls | 25.04 | 20.4 | 22.75% |
| Panorama City | 30.15 | 24.58 | 22.66% |
| South San Jose Hills | 30.86 | 25.16 | 22.66% |
| Rowland Heights | 41.13 | 33.54 | 22.63% |
| South Diamond Bar | 41.13 | 33.54 | 22.63% |
| Glassell Park | 42.44 | 34.61 | 22.62% |
| South El Monte | 33.56 | 27.38 | 22.57% |
| South Whittier | 32.48 | 26.5 | 22.57% |
| La Habra Heights | 23.83 | 19.46 | 22.46% |
| Vermont Square | 27.31 | 22.31 | 22.41% |
| Arcadia | 46.08 | 37.66 | 22.36% |
| North El Monte | 46.08 | 37.66 | 22.36% |
| Malibu | 38.38 | 31.39 | 22.27% |
| Lancaster | 26.07 | 21.34 | 22.16% |
| Arleta | 35.92 | 29.41 | 22.14% |
| Baldwin Park | 35.81 | 29.32 | 22.14% |
| East San Gabriel | 43.69 | 35.81 | 22.01% |
| East Los Angeles | 32.28 | 26.46 | 22.00% |
| La Puente | 32.86 | 26.95 | 21.93% |
| Jefferson Park | 34.42 | 28.25 | 21.84% |
| Torrance | 44.86 | 36.82 | 21.84% |
| Reseda | 38.92 | 32 | 21.63% |
| Winnetka | 38.15 | 31.37 | 21.61% |
| Lake Los Angeles | 19.11 | 15.72 | 21.56% |
| Adams-Normandie | 30.13 | 24.79 | 21.54% |
| Eagle Rock | 45.33 | 37.3 | 21.53% |
| South San Gabriel | 46.36 | 38.18 | 21.42% |
| Avocado Heights | 31.13 | 25.65 | 21.36% |
| Bellflower | 32.12 | 26.47 | 21.34% |
| Woodland Hills | 47.81 | 39.42 | 21.28% |
| Monrovia | 42.33 | 34.91 | 21.25% |
| Agoura Hills | 47.18 | 38.91 | 21.25% |
| Inglewood | 30.76 | 25.37 | 21.25% |
| Boyle Heights | 30.78 | 25.41 | 21.13% |
| Santa Fe Springs | 38.99 | 32.22 | 21.01% |
| Norwalk | 35.92 | 29.7 | 20.94% |
| West Whittier Los Nietos | 37.27 | 30.82 | 20.93% |
| Alhambra | 45.1 | 37.35 | 20.75% |
| Stevenson Ranch | 40.84 | 33.84 | 20.69% |
| Diamond Bar | 45.56 | 37.78 | 20.59% |
| La Mirada | 39.75 | 32.98 | 20.53% |
| Glendale | 34.37 | 28.53 | 20.47% |
| Pico Union | 27.43 | 22.79 | 20.36% |
| Downey | 38.67 | 32.15 | 20.28% |
| Temple City | 46.77 | 38.91 | 20.20% |
| Beverly Grove | 48.24 | 40.15 | 20.15% |
| Carthay | 48.24 | 40.15 | 20.15% |
| Rancho Park | 62.71 | 52.2 | 20.13% |
| Tujunga | 32.47 | 27.03 | 20.13% |
| Whittier | 39.53 | 32.91 | 20.12% |
| El Sereno | 37.48 | 31.22 | 20.05% |
| Leimert Park | 33.02 | 27.51 | 20.03% |
| Monterey Park | 47.17 | 39.32 | 19.96% |
| Pico-Robertson | 44.8 | 37.37 | 19.88% |
| West Adams | 33.9 | 28.28 | 19.87% |
| North Hills | 32.46 | 27.08 | 19.87% |
| Artesia | 42.27 | 35.27 | 19.85% |
| Hyde Park | 30.44 | 25.4 | 19.84% |
| Azusa | 31.45 | 26.25 | 19.81% |
| West Puente Valley | 37.06 | 30.95 | 19.74% |
| Hansen Dam | 34.54 | 28.85 | 19.72% |
| Lake View Terrace | 34.54 | 28.85 | 19.72% |
| South Pasadena | 52.42 | 43.79 | 19.71% |
| Calabasas | 50.52 | 42.22 | 19.66% |
| Baldwin Hills-Crenshaw | 31.22 | 26.1 | 19.62% |
| Sunland | 34.21 | 28.61 | 19.57% |
| Hacienda Heights | 42.69 | 35.71 | 19.55% |
| Charter Oak | 35.45 | 29.67 | 19.48% |
| West Carson | 44.59 | 37.32 | 19.48% |
| Mission Hills | 37.64 | 31.51 | 19.45% |
| Walnut | 49.63 | 41.55 | 19.45% |
| La Canada Flintridge | 52.74 | 44.16 | 19.43% |
| East La Mirada | 36.02 | 30.18 | 19.35% |
| Brentwood | 53.23 | 44.66 | 19.19% |
| Lakewood | 40.83 | 34.28 | 19.11% |
| Montebello | 37.03 | 31.11 | 19.03% |
| Hancock Park | 50.51 | 42.44 | 19.02% |
| Windsor Square | 50.51 | 42.44 | 19.02% |
| Gardena | 39.12 | 32.87 | 19.01% |
| Pico-Rivera | 39.29 | 33.02 | 18.99% |
| Alondra Park | 40.21 | 33.8 | 18.96% |
| Harbor City | 35.54 | 29.88 | 18.94% |
| Acton | 23.73 | 19.96 | 18.89% |
| Ramona | 35.5 | 29.87 | 18.85% |
| Vincent | 35.5 | 29.87 | 18.85% |
| Century City | 59.68 | 50.27 | 18.72% |
| San Pedro | 33.56 | 28.27 | 18.71% |
| Lomita | 38.15 | 32.15 | 18.66% |
| Rolling Hills Estates | 54.65 | 46.06 | 18.65% |
| Chatsworth Reservoir | 48.39 | 40.79 | 18.63% |
| West Hills | 48.39 | 40.79 | 18.63% |
| Northridge | 38.07 | 32.11 | 18.56% |
| East Pasadena | 49.22 | 41.59 | 18.35% |
| San Marino | 53.29 | 45.06 | 18.26% |
| Elysian Park | 47.42 | 40.12 | 18.20% |
| Altadena | 46.74 | 39.55 | 18.18% |
| Valinda | 35.58 | 30.11 | 18.17% |
| Chatsworth | 44.63 | 37.82 | 18.01% |
| West Covina | 43.41 | 36.8 | 17.96% |
| Palos Verdes Estates | 51.26 | 43.53 | 17.76% |
| Rancho Palos Verdes | 50.23 | 42.66 | 17.74% |
| Pasadena | 47.65 | 40.5 | 17.65% |
| Carson | 41.79 | 35.55 | 17.55% |
| Sierra Madre | 53.69 | 45.69 | 17.51% |
| Signal Hill | 43.66 | 37.17 | 17.46% |
| Manchester Square | 28.9 | 24.61 | 17.43% |
| Castaic | 28.23 | 24.06 | 17.33% |
| Hasley Canyon | 28.23 | 24.06 | 17.33% |
| Ridge Route | 28.23 | 24.06 | 17.33% |
| Pacific Palisades | 55.94 | 47.69 | 17.30% |
| Tarzana | 47.64 | 40.62 | 17.28% |
| Westwood | 35.76 | 30.51 | 17.21% |
| Covina | 41.23 | 35.2 | 17.13% |
| Cerritos | 51.96 | 44.45 | 16.90% |
| Mayflower Village | 42.34 | 36.24 | 16.83% |
| Rolling Hills | 51.38 | 44 | 16.77% |
| Long Beach | 38.05 | 32.6 | 16.72% |
| Santa Clarita | 38.98 | 33.45 | 16.53% |
| Granada Hills | 41.92 | 35.98 | 16.51% |
| Beverlywood | 52 | 44.64 | 16.49% |
| San Dimas | 42.21 | 36.34 | 16.15% |
| Claremont | 45.07 | 38.9 | 15.86% |
| Encino | 54.11 | 46.75 | 15.74% |
| Sepulveda Basin | 54.11 | 46.75 | 15.74% |
| Gramercy Park | 33.01 | 28.54 | 15.66% |
| North Whittier | 42.65 | 36.9 | 15.58% |
| Porter Ranch | 51.24 | 44.36 | 15.51% |
| La Verne | 41.89 | 36.37 | 15.18% |
| Quartz Hill | 26.29 | 22.83 | 15.16% |
| Glendora | 41.88 | 36.52 | 14.68% |
| Duarte | 44.29 | 38.7 | 14.44% |
| Beverly Hills | 51.69 | 45.46 | 13.70% |
| Cheviot Hills | 63.66 | 56.17 | 13.33% |
| Beverly Crest | 53.98 | 47.66 | 13.26% |
| Bel-Air | 52.68 | 46.66 | 12.90% |
| Pomona | 27.43 | 24.37 | 12.56% |
| View Park-Windsor Hills | 42.92 | 38.37 | 11.86% |
| Ladera Heights | 47.48 | 42.54 | 11.61% |
| Castaic Canyons | 37.9 | 34.26 | 10.62% |
| Green Valley | 37.9 | 34.26 | 10.62% |
How We Did It: We examined publicly available data on coronavirus vaccinations from the Los Angeles County Department of Public Health. In some cases information may have changed from what was originally published.
Interested in our data? Check out the Crosstown coronavirus interactive map or email us at askus@xtown.la.


