

In Los Angeles, taking on tagging hits new heights


In recent months, the relaxing of pandemic restrictions has brought more people out of their homes and onto the streets. But that is not the only sign of increased activity—across Los Angeles, more graffiti is being painted over.
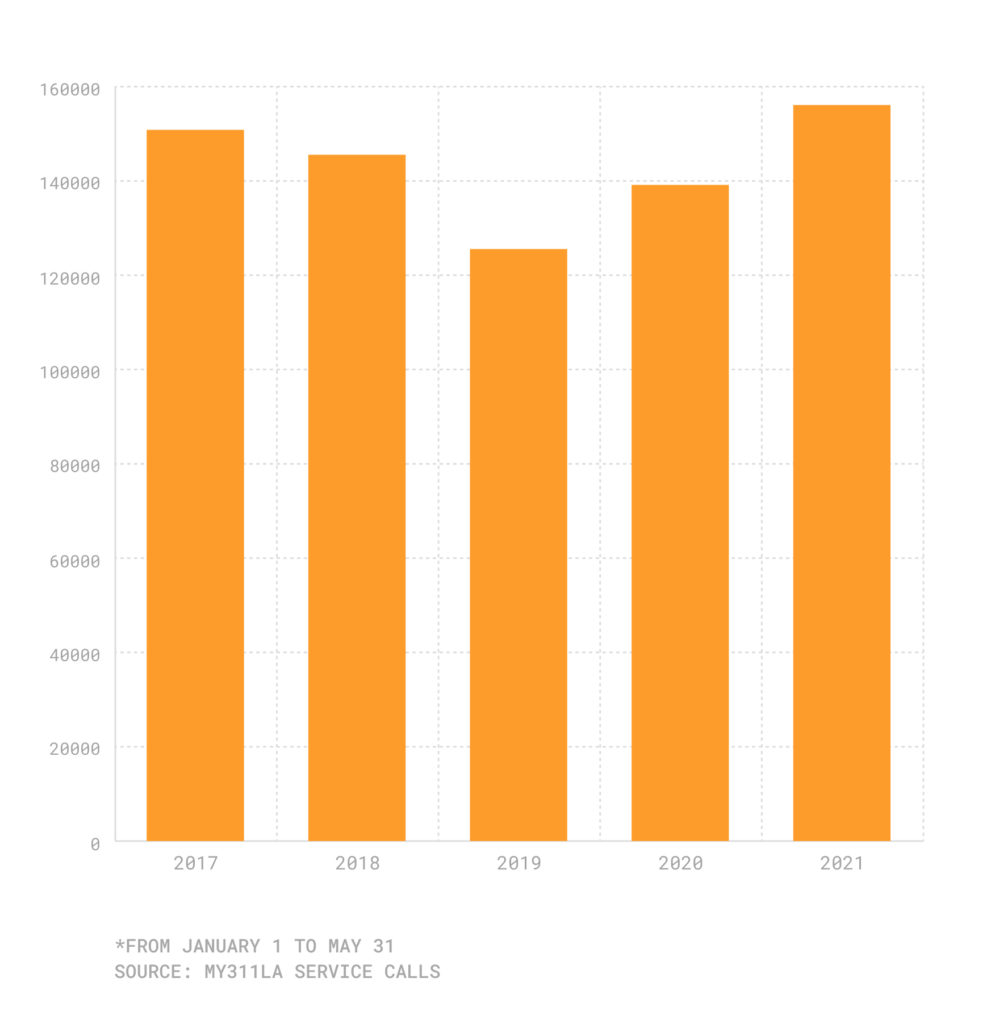
From Jan. 1-May 31, there were 156,030 service requests for graffiti removal in the city, according to My311 LA data. That represents a 10% increase over the same period last year, and a 24% spike over the comparable timeframe in 2019.
My311 graffiti removal calls, Jan. 1-May 31, 2017-2021
Does that mean taggers are more active than in previous years? It is hard to tell. According to Paul Racs, the director of the city’s Office of Community Beautification, more graffiti is being eradicated than in previous years because there are now more contractors in certain neighborhoods erasing tags. The overall My311 figures include not just residents reporting graffiti to the city, but also each time a contractor erases a piece, whether it has been called in or not.
“That’s why we’re looking at a citywide increase of about 10 million more square feet of graffiti being removed, because for the first time in several years, our crews have been able to work full time, 40 hours a week,” Racs said.
[Get COVID-19, crime and other stats about where you live with the Crosstown Neighborhood Newsletter]
As Crosstown reported earlier this year, an increase in graffiti removal calls from residents could stem from a number of factors, among them gentrification, tension between gangs, and protests and social unrest.
Two days or less
When it comes to graffiti complaints, Racs said that most people call the city’s My311 line or make a request on the website. The Office of Community Beautification fields the call, then directs it to one of the 12 nonprofit organizations that each work in a different part of the city.
Racs said that 77% of the calls generate a clean-up within 48 hours of the request.
However, requests for service only account for about one-third of the contractors’ work. Racs said more often the teams in the neighborhoods proactively paint over any visible graffiti, often before someone even has the chance to report it.
“We’re actually on pace to remove a lot more graffiti this year than in past years, just because our contractors are out there proactively removing it,” Racs said.
Safer, cleaner communities
Graffiti left unchecked can have numerous impacts. One school of thought holds that allowing it to stay up can be a sign of permissiveness and lead to crime. There are also economic and community repercussions.
“People don’t want to shop in a neighborhood that’s all tagged up,” Racs said. “They don’t feel safe. They don’t want to open a business there, which is why the city is in the business of doing graffiti abatement.”
The neighborhood with the greatest number of complaints in the first five months of the year was Historic South-Central, where there were 14,934 calls for service. That represents a spike from just 906 calls in 2017. That is also one of the neighborhoods where contractors are more frequently working than in the past.
Los Angeles neighborhoods with the most My311 graffiti calls, Jan. 1-May 31, 2021
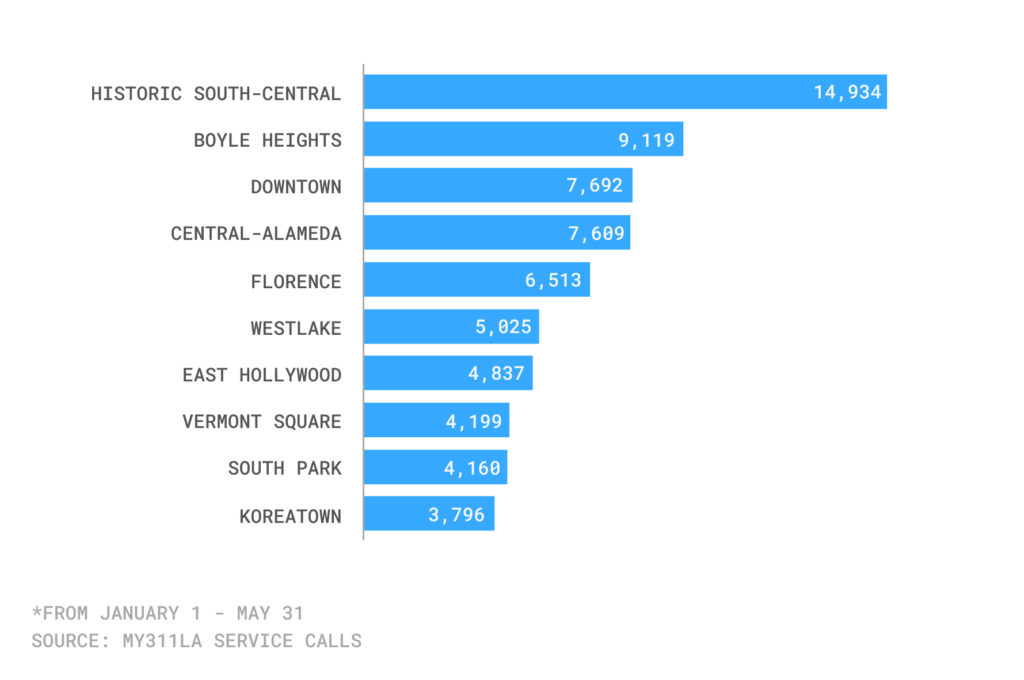
The neighborhood with the second highest number of calls was Boyle Heights. The 9,119 calls from Jan.1-May 31 is up 182% from the same timeframe in the pre-pandemic year of 2019.
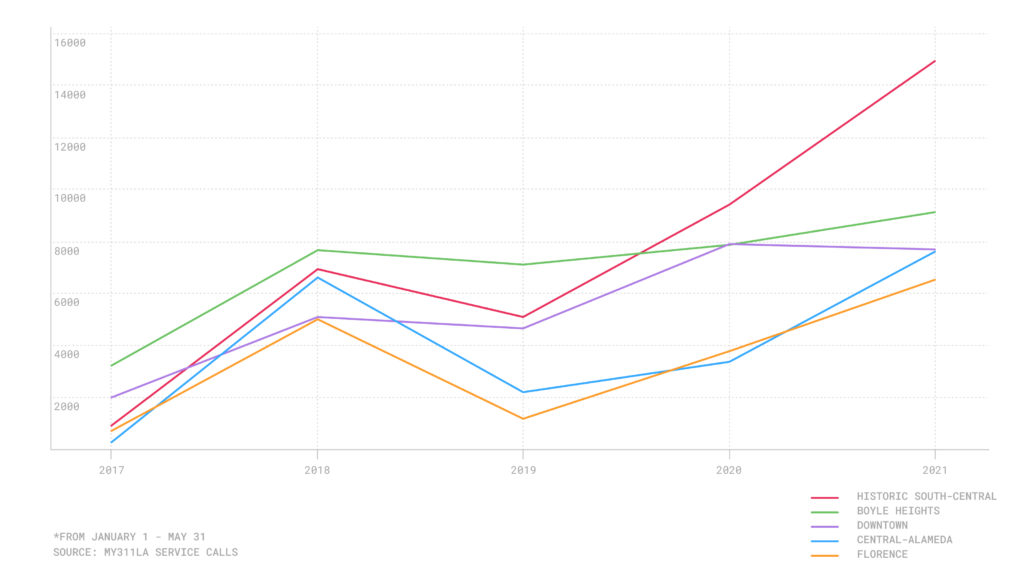
Graffiti calls in five Los Angeles neighborhoods, Jan. 1-May 31, 2017-2021
In March, My311 had the highest number of monthly service requests since 2015, with more than 35,000 calls (again, the figure includes proactive cleaning from the contractors). In May, there were 31,365 requests.
How we did it: We examined publicly available My311 data during the period of Jan.1-May 31 from 2017-2021. Learn more about our data here.
Want to know how your neighborhood fares? Or simply interested in our data? Email us at askus@xtown.la.


