

COVID cases rise in lower-income communities, again


The Delta variant’s stampede across Los Angeles has slowed in recent weeks, with the number of new daily infections plateauing in the general range of 2,500-3,500, and hospitalizations declining.
Yet improvements are far from uniform, with some of the poorest parts of Los Angeles still experiencing a surge, while certain wealthy areas are enjoying a decrease in cases.
[Scroll down to find out how your LA community fared last month.]
That appears to be another reversal from the course the virus was taking just a few weeks ago. Crosstown last month reported that the surge in cases brought on by the Delta variant was being heavily felt in some wealthier communities. South Pasadena, Bel-Air and Manhattan Beach were among the neighborhoods that saw a large percentage increase in cases.
[Get COVID-19, crime and other stats about where you live with the Crosstown Neighborhood Newsletter]
In the last few weeks, that has shifted again, as a number of lower-income areas have started to see numbers rise.
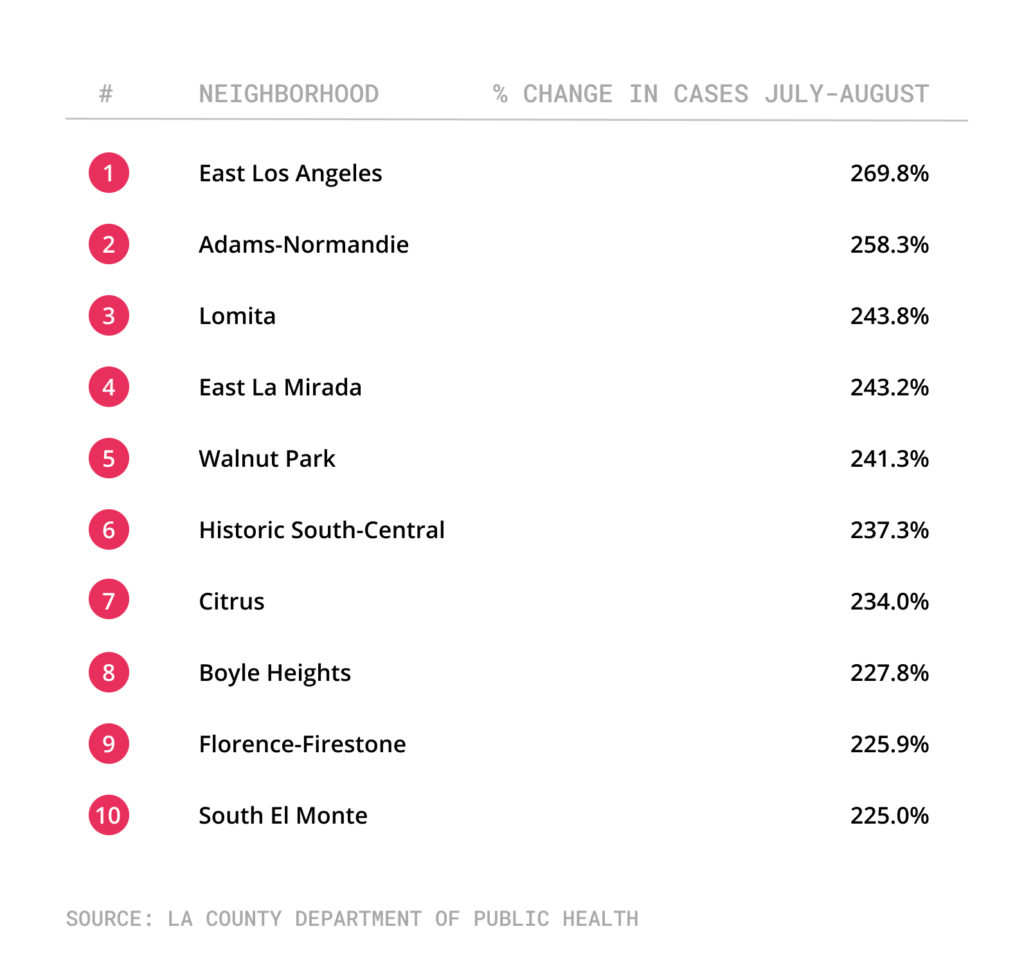
East Los Angeles experienced the largest percentage increase, a 270% shift from the 381 cases in July to 1,409 in August. There was a 237% jump in Historic South-Central, the 110 July cases ballooning to 371 the following month.
Neighborhoods with greatest increase in coronavirus cases from July to August
The spike in those neighborhoods may also reflect comparatively lower vaccination rates. For example, according to the Los Angeles County Department of Public Health, 85.5% of people 12 and older in South Pasadena have received at least one dose of a coronavirus vaccine. In Manhattan Beach the rate is 84.7%.
By comparison, in unincorporated East Los Angeles, 70.2% of residents have received at least one dose. The rate in Adams-Normandie is 67.4%.
As lower-income neighborhoods continue to suffer, some of the wealthier areas hit hard a month ago are now seeing conditions improve. West Hollywood experienced a monthly caseload drop of 25%, from 556 infections in July to 417 in August. In Bel-Air, the 64 cases in July declined 14%, to 55 last month.
In Beverly Hills the month-to-month decline was 3%. In Brentwood it was 2.8%.
During the pandemic, Los Angeles County has sometimes seen surges of the virus start in relatively affluent neighborhoods, and then migrate into lower-income areas with a greater number of essential workers who are largely unable to do their job from home. These communities have been hit disproportionately hard and for sustained periods.
Find out how your community fared between July and August
Use the table to sort by different categories.
| Neighborhood | New cases in July | New cases in August | # change | % change | |||
| acton | 30 | 114 | 84 | 280.00% | |||
| adams-normandie | 24 | 86 | 62 | 258.33% | |||
| agoura-hills | 92 | 192 | 100 | 108.70% | |||
| agua-dulce | 21 | 49 | 28 | 133.33% | |||
| alhambra | 297 | 587 | 290 | 97.64% | |||
| alondra-park | 36 | 56 | 20 | 55.56% | |||
| altadena | 189 | 301 | 112 | 59.26% | |||
| angeles-crest | 8 | 15 | 7 | 87.50% | |||
| arcadia | 168 | 255 | 87 | 51.79% | |||
| arleta | 148 | 360 | 212 | 143.24% | |||
| arlington-heights | 40 | 60 | 20 | 50.00% | |||
| artesia | 68 | 210 | 142 | 208.82% | |||
| atwater-village | 74 | 123 | 49 | 66.22% | |||
| avalon | 3 | 7 | 4 | 133.33% | |||
| avocado-heights | 48 | 143 | 95 | 197.92% | |||
| azusa | 195 | 499 | 304 | 155.90% | |||
| baldwin-hillscrenshaw | 245 | 361 | 116 | 47.35% | |||
| baldwin-park | 252 | 703 | 451 | 178.97% | |||
| bel-air | 64 | 55 | -9 | -14.06% | |||
| bell | 132 | 355 | 223 | 168.94% | |||
| bellflower | 495 | 1011 | 516 | 104.24% | |||
| bell-gardens | 121 | 352 | 231 | 190.91% | |||
| beverly-crest | 90 | 89 | -1 | -1.11% | |||
| beverly-grove | 193 | 246 | 53 | 27.46% | |||
| beverly-hills | 359 | 348 | -11 | -3.06% | |||
| beverlywood | 97 | 147 | 50 | 51.55% | |||
| boyle-heights | 273 | 895 | 622 | 227.84% | |||
| bradbury | 0 | 2 | 2 | #DIV/0! | |||
| brentwood | 209 | 203 | -6 | -2.87% | |||
| broadway-manchester | 307 | 683 | 376 | 122.48% | |||
| burbank | 605 | 928 | 323 | 53.39% | |||
| calabasas | 134 | 192 | 58 | 43.28% | |||
| canoga-park | 270 | 708 | 438 | 162.22% | |||
| carson | 498 | 1043 | 545 | 109.44% | |||
| carthay | 193 | 246 | 53 | 27.46% | |||
| castaic | 154 | 295 | 141 | 91.56% | |||
| castaic-canyons | 109 | 159 | 50 | 45.87% | |||
| central-alameda | 178 | 563 | 385 | 216.29% | |||
| century-city | 75 | 99 | 24 | 32.00% | |||
| cerritos | 147 | 304 | 157 | 106.80% | |||
| charter-oak | 56 | 129 | 73 | 130.36% | |||
| chatsworth | 219 | 422 | 203 | 92.69% | |||
| chatsworth-reservoir | 253 | 405 | 152 | 60.08% | |||
| chesterfield-square | 233 | 493 | 260 | 111.59% | |||
| cheviot-hills | 56 | 79 | 23 | 41.07% | |||
| chinatown | 57 | 78 | 21 | 36.84% | |||
| citrus | 47 | 157 | 110 | 234.04% | |||
| claremont | 96 | 253 | 157 | 163.54% | |||
| commerce | 72 | 169 | 97 | 134.72% | |||
| compton | 552 | 1131 | 579 | 104.89% | |||
| covina | 244 | 594 | 350 | 143.44% | |||
| cudahy | 103 | 306 | 203 | 197.09% | |||
| culver-city | 219 | 263 | 44 | 20.09% | |||
| cypress-park | 102 | 164 | 62 | 60.78% | |||
| del-aire | 58 | 84 | 26 | 44.83% | |||
| del-rey | 218 | 255 | 37 | 16.97% | |||
| desert-view-highlands | 11 | 24 | 13 | 118.18% | |||
| diamond-bar | 180 | 330 | 150 | 83.33% | |||
| downey | 565 | 1316 | 751 | 132.92% | |||
| downtown | 755 | 1343 | 588 | 77.88% | |||
| duarte | 87 | 207 | 120 | 137.93% | |||
| eagle-rock | 175 | 284 | 109 | 62.29% | |||
| east-compton | 74 | 152 | 78 | 105.41% | |||
| east-hollywood | 143 | 308 | 165 | 115.38% | |||
| east-la-mirada | 37 | 127 | 90 | 243.24% | |||
| east-los-angeles | 381 | 1409 | 1028 | 269.82% | |||
| east-pasadena | 4 | 8 | 4 | 100.00% | |||
| east-san-gabriel | 49 | 122 | 73 | 148.98% | |||
| echo-park | 305 | 527 | 222 | 72.79% | |||
| elizabeth-lake | 3 | 9 | 6 | 200.00% | |||
| el-monte | 330 | 830 | 500 | 151.52% | |||
| el-segundo | 95 | 124 | 29 | 30.53% | |||
| el-sereno | 175 | 421 | 246 | 140.57% | |||
| elysian-park | 34 | 53 | 19 | 55.88% | |||
| elysian-valley | 38 | 77 | 39 | 102.63% | |||
| encino | 312 | 447 | 135 | 43.27% | |||
| exposition-park | 246 | 427 | 181 | 73.58% | |||
| fairfax | 548 | 723 | 175 | 31.93% | |||
| florence | 188 | 596 | 408 | 217.02% | |||
| florence-firestone | 220 | 717 | 497 | 225.91% | |||
| gardena | 351 | 633 | 282 | 80.34% | |||
| glassell-park | 109 | 276 | 167 | 153.21% | |||
| glendale | 1104 | 2083 | 979 | 88.68% | |||
| glendora | 212 | 513 | 301 | 141.98% | |||
| gramercy-park | 111 | 168 | 57 | 51.35% | |||
| granada-hills | 379 | 672 | 293 | 77.31% | |||
| green-meadows | 307 | 683 | 376 | 122.48% | |||
| green-valley | 109 | 159 | 50 | 45.87% | |||
| griffith-park | 200 | 301 | 101 | 50.50% | |||
| hacienda-heights | 177 | 370 | 193 | 109.04% | |||
| hancock-park | 113 | 125 | 12 | 10.62% | |||
| hansen-dam | 65 | 166 | 101 | 155.38% | |||
| harbor-city | 186 | 335 | 149 | 80.11% | |||
| harbor-gateway | 233 | 402 | 169 | 72.53% | |||
| harvard-heights | 68 | 128 | 60 | 88.24% | |||
| harvard-park | 233 | 493 | 260 | 111.59% | |||
| hasley-canyon | 154 | 295 | 141 | 91.56% | |||
| hawaiian-gardens | 75 | 157 | 82 | 109.33% | |||
| hawthorne | 535 | 915 | 380 | 71.03% | |||
| hermosa-beach | 145 | 231 | 86 | 59.31% | |||
| hidden-hills | 12 | 16 | 4 | 33.33% | |||
| highland-park | 223 | 372 | 149 | 66.82% | |||
| historic-south-central | 110 | 371 | 261 | 237.27% | |||
| hollywood | 749 | 821 | 72 | 9.61% | |||
| hollywood-hills | 269 | 300 | 31 | 11.52% | |||
| hollywood-hills-west | 269 | 300 | 31 | 11.52% | |||
| huntington-park | 179 | 499 | 320 | 178.77% | |||
| hyde-park | 262 | 412 | 150 | 57.25% | |||
| industry | 1 | 14 | 13 | 1300.00% | |||
| inglewood | 973 | 1252 | 279 | 28.67% | |||
| irwindale | 5 | 33 | 28 | 560.00% | |||
| jefferson-park | 45 | 86 | 41 | 91.11% | |||
| koreatown | 558 | 899 | 341 | 61.11% | |||
| la-canada-flintridge | 64 | 137 | 73 | 114.06% | |||
| la-crescenta-montrose | 64 | 145 | 81 | 126.56% | |||
| ladera-heights | 61 | 65 | 4 | 6.56% | |||
| la-habra-heights | 4 | 5 | 1 | 25.00% | |||
| lake-balboa | 244 | 463 | 219 | 89.75% | |||
| lake-hughes | 1 | 3 | 2 | 200.00% | |||
| lake-los-angeles | 50 | 133 | 83 | 166.00% | |||
| lake-view-terrace | 65 | 166 | 101 | 155.38% | |||
| lakewood | 494 | 858 | 364 | 73.68% | |||
| la-mirada | 187 | 470 | 283 | 151.34% | |||
| lancaster | 1029 | 2416 | 1387 | 134.79% | |||
| la-puente | 147 | 394 | 247 | 168.03% | |||
| larchmont | 548 | 723 | 175 | 31.93% | |||
| la-verne | 98 | 305 | 207 | 211.22% | |||
| lawndale | 158 | 278 | 120 | 75.95% | |||
| leimert-park | 136 | 198 | 62 | 45.59% | |||
| lennox | 69 | 182 | 113 | 163.77% | |||
| leona-valley | 8 | 12 | 4 | 50.00% | |||
| lincoln-heights | 147 | 301 | 154 | 104.76% | |||
| littlerock | 7 | 49 | 42 | 600.00% | |||
| lomita | 64 | 220 | 156 | 243.75% | |||
| long-beach | 2216 | 4888 | 2672 | 120.58% | |||
| lopezkagel-canyons | 8 | 21 | 13 | 162.50% | |||
| los-feliz | 200 | 301 | 101 | 50.50% | |||
| lynwood | 324 | 700 | 376 | 116.05% | |||
| malibu | 66 | 92 | 26 | 39.39% | |||
| manchester-square | 70 | 140 | 70 | 100.00% | |||
| manhattan-beach | 191 | 298 | 107 | 56.02% | |||
| marina-del-rey | 103 | 108 | 5 | 4.85% | |||
| mar-vista | 305 | 289 | -16 | -5.25% | |||
| mayflower-village | 71 | 137 | 66 | 92.96% | |||
| maywood | 91 | 264 | 173 | 190.11% | |||
| mid-city | 400 | 600 | 200 | 50.00% | |||
| mid-wilshire | 339 | 402 | 63 | 18.58% | |||
| mission-hills | 166 | 319 | 153 | 92.17% | |||
| monrovia | 135 | 344 | 209 | 154.81% | |||
| montebello | 247 | 650 | 403 | 163.16% | |||
| montecito-heights | 147 | 301 | 154 | 104.76% | |||
| monterey-park | 164 | 334 | 170 | 103.66% | |||
| mount-washington | 102 | 164 | 62 | 60.78% | |||
| northeast-antelope-valley | 20 | 68 | 48 | 240.00% | |||
| north-el-monte | 168 | 255 | 87 | 51.79% | |||
| north-hills | 261 | 661 | 400 | 153.26% | |||
| north-hollywood | 1122 | 1717 | 595 | 53.03% | |||
| northridge | 441 | 723 | 282 | 63.95% | |||
| northwest-antelope-valley | 8 | 33 | 25 | 312.50% | |||
| northwest-palmdale | 14 | 41 | 27 | 192.86% | |||
| north-whittier | 66 | 88 | 22 | 33.33% | |||
| norwalk | 478 | 1141 | 663 | 138.70% | |||
| pacific-palisades | 113 | 155 | 42 | 37.17% | |||
| pacoima | 322 | 889 | 567 | 176.09% | |||
| palmdale | 827 | 2105 | 1278 | 154.53% | |||
| palms | 251 | 329 | 78 | 31.08% | |||
| palos-verdes-estates | 52 | 82 | 30 | 57.69% | |||
| panorama-city | 349 | 779 | 430 | 123.21% | |||
| paramount | 285 | 641 | 356 | 124.91% | |||
| pasadena | 530 | 846 | 316 | 59.62% | |||
| pico-rivera | 232 | 681 | 449 | 193.53% | |||
| pico-robertson | 59 | 117 | 58 | 98.31% | |||
| pico-union | 127 | 354 | 227 | 178.74% | |||
| playa-del-rey | 21 | 27 | 6 | 28.57% | |||
| playa-vista | 83 | 117 | 34 | 40.96% | |||
| pomona | 740 | 2365 | 1625 | 219.59% | |||
| porter-ranch | 203 | 340 | 137 | 67.49% | |||
| quartz-hill | 69 | 143 | 74 | 107.25% | |||
| ramona | 76 | 190 | 114 | 150.00% | |||
| rancho-dominguez | 34 | 37 | 3 | 8.82% | |||
| rancho-palos-verdes | 139 | 258 | 119 | 85.61% | |||
| rancho-park | 52 | 56 | 4 | 7.69% | |||
| redondo-beach | 324 | 571 | 247 | 76.23% | |||
| reseda | 445 | 998 | 553 | 124.27% | |||
| ridge-route | 154 | 295 | 141 | 91.56% | |||
| rolling-hills | 8 | 20 | 12 | 150.00% | |||
| rolling-hills-estates | 45 | 69 | 24 | 53.33% | |||
| rosemead | 106 | 289 | 183 | 172.64% | |||
| rowland-heights | 96 | 251 | 155 | 161.46% | |||
| san-clemente-island | 0 | 0 | 0 | #DIV/0! | |||
| san-dimas | 128 | 366 | 238 | 185.94% | |||
| san-fernando | 136 | 349 | 213 | 156.62% | |||
| san-gabriel | 87 | 167 | 80 | 91.95% | |||
| san-marino | 12 | 43 | 31 | 258.33% | |||
| san-pasqual | 1 | 2 | 1 | 100.00% | |||
| san-pedro | 447 | 1012 | 565 | 126.40% | |||
| santa-clarita | 1372 | 2773 | 1401 | 102.11% | |||
| santa-fe-springs | 94 | 236 | 142 | 151.06% | |||
| santa-monica | 625 | 675 | 50 | 8.00% | |||
| sawtelle | 272 | 340 | 68 | 25.00% | |||
| sepulveda-basin | 312 | 447 | 135 | 43.27% | |||
| shadow-hills | 31 | 37 | 6 | 19.35% | |||
| sherman-oaks | 721 | 911 | 190 | 26.35% | |||
| sierra-madre | 39 | 61 | 22 | 56.41% | |||
| signal-hill | 92 | 107 | 15 | 16.30% | |||
| silver-lake | 295 | 416 | 121 | 41.02% | |||
| south-diamond-bar | 96 | 251 | 155 | 161.46% | |||
| southeast-antelope-valley | 30 | 61 | 31 | 103.33% | |||
| south-el-monte | 60 | 195 | 135 | 225.00% | |||
| south-gate | 478 | 1200 | 722 | 151.05% | |||
| south-park | 146 | 471 | 325 | 222.60% | |||
| south-pasadena | 91 | 176 | 85 | 93.41% | |||
| south-san-gabriel | 16 | 51 | 35 | 218.75% | |||
| south-san-jose-hills | 68 | 155 | 87 | 127.94% | |||
| south-whittier | 220 | 636 | 416 | 189.09% | |||
| stevenson-ranch | 118 | 227 | 109 | 92.37% | |||
| studio-city | 194 | 213 | 19 | 9.79% | |||
| sunland | 95 | 219 | 124 | 130.53% | |||
| sun-valley | 279 | 570 | 291 | 104.30% | |||
| sun-village | 19 | 38 | 19 | 100.00% | |||
| sylmar | 512 | 1064 | 552 | 107.81% | |||
| tarzana | 156 | 342 | 186 | 119.23% | |||
| temple-city | 63 | 173 | 110 | 174.60% | |||
| toluca-lake | 98 | 103 | 5 | 5.10% | |||
| topanga | 78 | 126 | 48 | 61.54% | |||
| torrance | 519 | 993 | 474 | 91.33% | |||
| tujunga | 128 | 321 | 193 | 150.78% | |||
| tujunga-canyons | 2 | 1 | -1 | -50.00% | |||
| unincorporated-catalina-island | 6 | 30 | 24 | 400.00% | |||
| unincorporated-santa-monica-mountains | 78 | 126 | 48 | 61.54% | |||
| unincorporated-santa-susana-mountains | 16 | 13 | -3 | -18.75% | |||
| university-park | 120 | 235 | 115 | 95.83% | |||
| valinda | 95 | 249 | 154 | 162.11% | |||
| valley-glen | 186 | 366 | 180 | 96.77% | |||
| valley-village | 203 | 327 | 124 | 61.08% | |||
| val-verde | 16 | 48 | 32 | 200.00% | |||
| van-nuys | 469 | 1015 | 546 | 116.42% | |||
| venice | 364 | 406 | 42 | 11.54% | |||
| vermont-knolls | 102 | 256 | 154 | 150.98% | |||
| vermont-slauson | 233 | 493 | 260 | 111.59% | |||
| vermont-square | 342 | 811 | 469 | 137.13% | |||
| vermont-vista | 293 | 694 | 401 | 136.86% | |||
| vernon | 5 | 2 | -3 | -60.00% | |||
| veterans-administration | -35 | 13 | 48 | -137.14% | |||
| view-park-windsor-hills | 86 | 124 | 38 | 44.19% | |||
| vincent | 76 | 190 | 114 | 150.00% | |||
| walnut | 80 | 178 | 98 | 122.50% | |||
| walnut-park | 46 | 157 | 111 | 241.30% | |||
| watts | 231 | 569 | 338 | 146.32% | |||
| west-adams | 354 | 602 | 248 | 70.06% | |||
| west-carson | 99 | 223 | 124 | 125.25% | |||
| westchester | 331 | 409 | 78 | 23.56% | |||
| west-compton | 41 | 87 | 46 | 112.20% | |||
| west-covina | 485 | 972 | 487 | 100.41% | |||
| west-hills | 253 | 405 | 152 | 60.08% | |||
| west-hollywood | 556 | 417 | -139 | -25.00% | |||
| westlake | 321 | 583 | 262 | 81.62% | |||
| westlake-village | 10 | 17 | 7 | 70.00% | |||
| west-los-angeles | 272 | 340 | 68 | 25.00% | |||
| westmont | 293 | 536 | 243 | 82.94% | |||
| west-puente-valley | 77 | 240 | 163 | 211.69% | |||
| west-san-dimas | 5 | 4 | -1 | -20.00% | |||
| west-whittier-los-nietos | 102 | 321 | 219 | 214.71% | |||
| westwood | 272 | 359 | 87 | 31.99% | |||
| whittier | 352 | 973 | 621 | 176.42% | |||
| whittier-narrows | 47 | -7 | -54 | -114.89% | |||
| willowbrook | 391 | 921 | 530 | 135.55% | |||
| wilmington | 259 | 688 | 429 | 165.64% | |||
| windsor-square | 113 | 125 | 12 | 10.62% | |||
| winnetka | 247 | 530 | 283 | 114.57% | |||
| woodland-hills | 474 | 786 | 312 | 65.82% | |||
How we did it: We analyzed coronavirus data provided by the Los Angeles County Department of Public Health from April 1 through August 31, 2021.
Interested in our data? Check out the Crosstown coronavirus interactive map or email us at askus@xtown.la.


