

Mapping the Los Angeles murder crisis


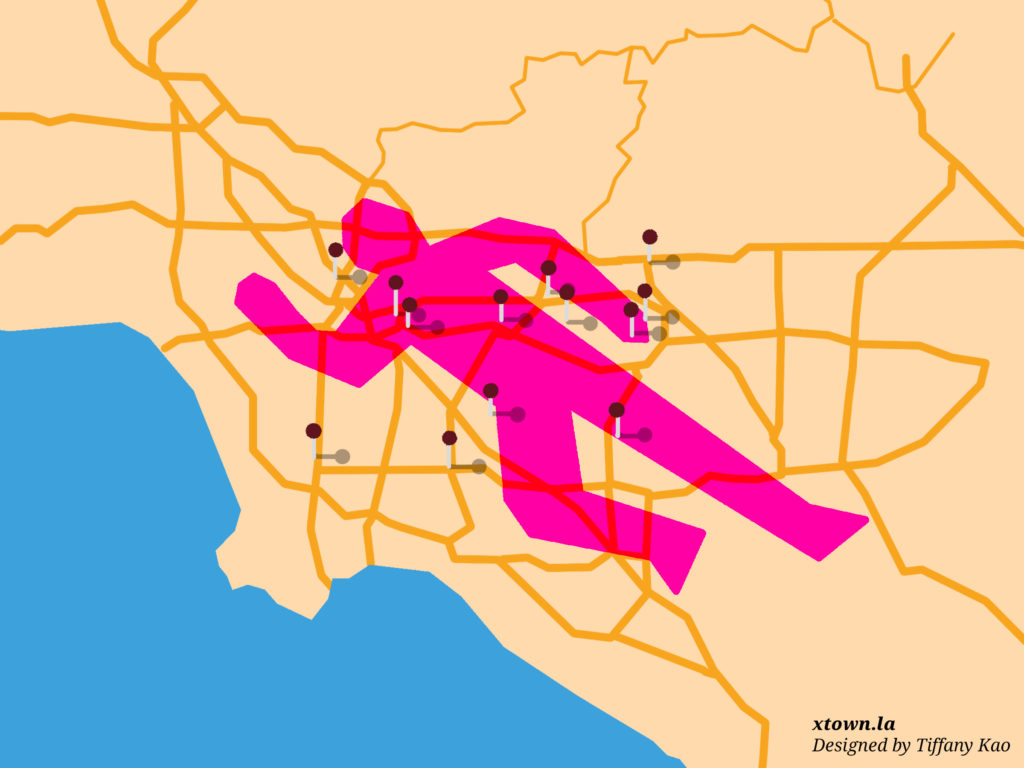
Los Angeles is on pace to experience its highest number of annual murders in more than a decade. Through Oct. 23, the city recorded 325 homicides, a 17.3% increase over the 277 killed in the same time period last year, and a 49.1% jump over the 218 victims in the timeframe in 2019.
But a few pockets of the city are suffering the brunt of this burden. The Los Angeles Police Department has 21 community police stations. Areas patrolled by just two of them account for 27.7% of those killed so far this year.
It is well known that certain neighborhoods suffer from disproportionately high rates of murder and other violent crime. Rampant poverty, inadequate educational choices, institutional racism and the presence of street gangs are among the factors that have long resulted in some communities enduring more than their fair share of pain.
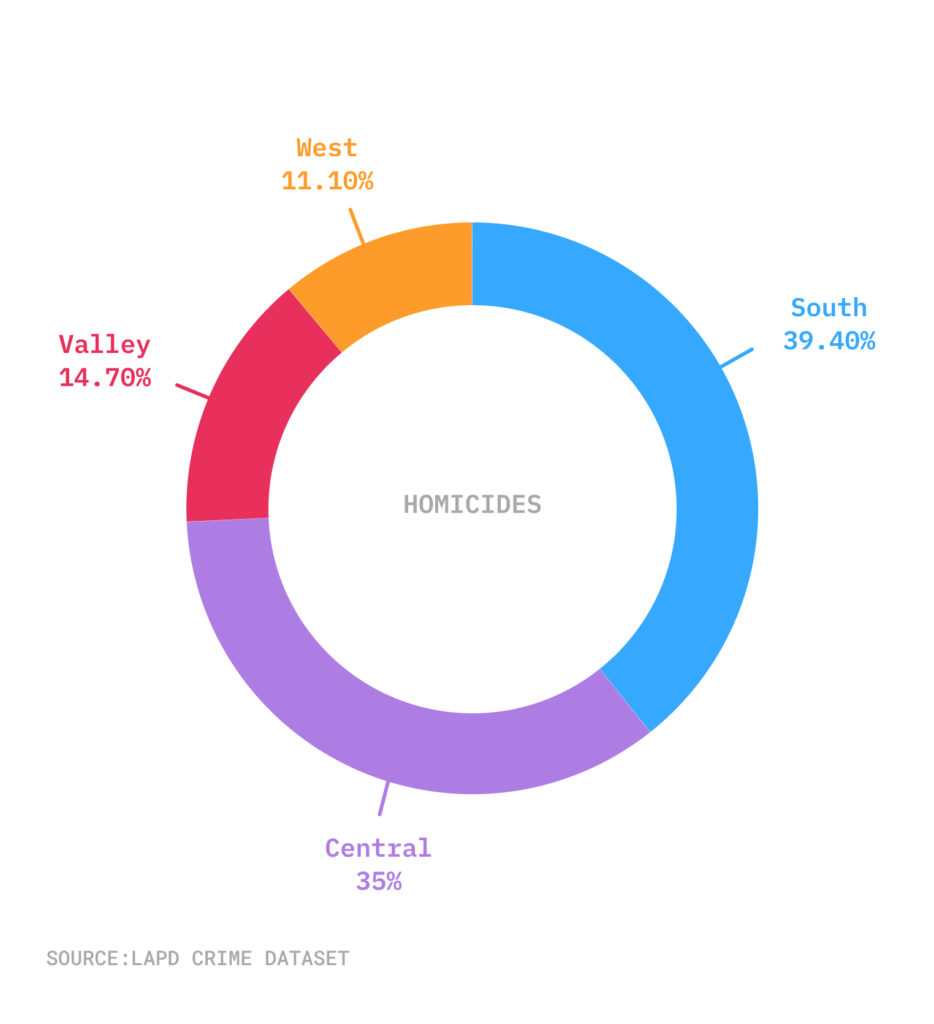
The LAPD is divided into four geographic bureaus, dubbed Central, South, Valley and West (each encompasses between four and seven community stations). From Jan. 1-Oct. 23 of this year, 74.4% of the 325 murders have taken place in the South and Central bureaus. Just 11% of homicides were recorded in the West Bureau.
Homicides by LAPD geographic bureau, Jan. 1-Oct. 23, 2021
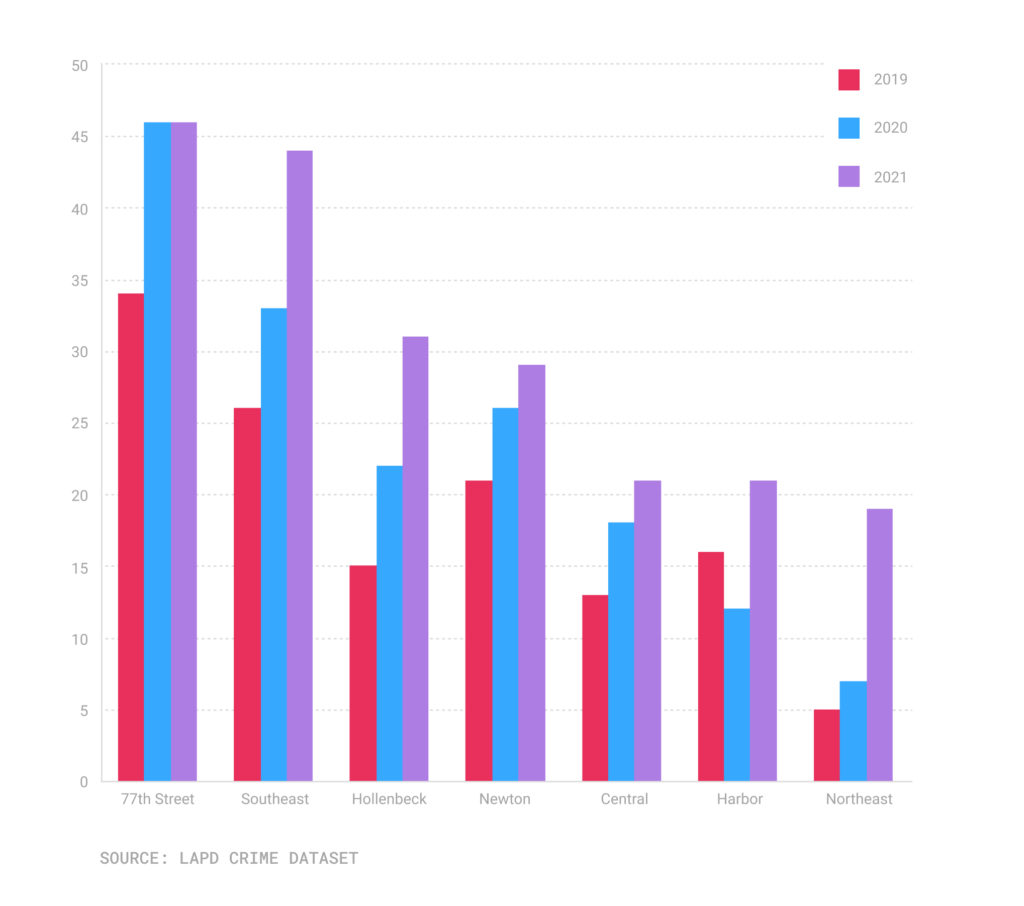
A pair of South Bureau stations have experienced the greatest number of murders, according to publicly accessible LAPD data. There have been 46 homicides in the 77th Street Station territory, which includes the communities of Hyde Park (site of 11 killings), Gramercy Park and Vermont Knolls (six homicides each). The area patrolled by officers assigned to Southeast Station has seen 44 homicides. Communities in Southeast include Watts (20 murders).
[Get COVID-19, crime and other stats about where you live with the Crosstown Neighborhood Newsletter]
Of the South Bureau stations, Southeast has seen the biggest statistical jump in homicides compared to the pre-pandemic year of 2019—a 69.2% jump over the 26 two years ago.
Central focus
The five stations in Central Bureau have together recorded 114 murders this year. That includes Hollenbeck, where the 31 homicides is a 40.9% rise over the 22 in the same period last year, and a 106.7% increase over the 15 in the timeframe in 2019, according to LAPD Compstat data. The station patrols communities including Boyle Heights (11 homicides this year), El Sereno (eight deaths) and Lincoln Heights (seven killings).
Homicides by Los Angeles Police Department station, 2019-2021
The youngest victim in the Hollenbeck territory was a 15-year-old male Latino who was shot in a vacant lot on Echandia Street in Boyle Heights on Jan. 2, according to LAPD data. The oldest was a 78-year-old man who was beaten to death on Aug. 18 on a sidewalk in Lincoln Heights.
The Central Bureau station with the greatest percentage gain over 2019 is Northeast, which patrols communities including East Hollywood (four homicides), Echo Park and Glassell Park (three each). The area has seen 19 murders so far this year, a 280% spike compared with five at the same point in 2019.
There have been five murders just in the Northeast station’s Highland Park in 2021, with all the victims killed by gunfire. That includes a 56-year-old man shot near Avenue 60 and the 110 Freeway on Feb. 1.
There are seven LAPD stations in the Valley Bureau, and through Oct. 23 none had seen double-digit murders.
The only LAPD station without a murder so far in 2021 is West L.A. Last year at this point there had been four homicides in the area. There was just one at the same time in 2019.
Los Angeles is on pace to record about 400 homicides this year, a death toll not reached in approximately 15 years.
How we did it: We examined publicly available crime data from the Los Angeles Police Department from Jan. 1, 2019-Oct. 23, 2021, as well as LAPD Compstat data. Learn more about our data here.
LAPD data only reflects crimes that are reported to the department, not how many crimes actually occurred. In making our calculations, we rely on the data the LAPD makes publicly available. LAPD may update past crime reports with new information, or recategorize past reports. Those revised reports do not always automatically become part of the public database.
Want to know how your neighborhood fares? Or simply just interested in our data? Email us at askus@xtown.la.


