

The Crosstown COVID Tracker


![]()
As Omicron cases continue to decline, the Los Angeles County Department of Public Health is broaching strategies for the “post surge” era. Department leaders warn that the designation will not mean the pandemic has ended, but rather that COVID-19 metrics are stabilizing across the county. The barometer for “post-surge” is when daily hospitalizations remain below 2,500 for seven days in a row.
While many indicators continue to improve, the situation remains serious. The Department of Public Health recently identified COVID-19 as the leading cause of death among older and unvaccinated county residents. COVID-19 surpassed coronary heart disease, historically the leading cause of death among older individuals.
The Crosstown COVID Tracker helps you stay up to date on the latest and most important data on infections, inoculations and general risk. Information on cases in individual communities is available on the Crosstown coronavirus interactive map.
The big count
The Department of Public Health reported 5,100 new COVID-19 cases on Wednesday. As a point of comparison, one month prior, on Jan. 9, there were 45,584 new cases. The seven-day average is now 8,235, a 53.3% decrease from the average one week ago.
Weekly COVID-19 cases in Los Angeles County, Jan. 5-Feb. 8
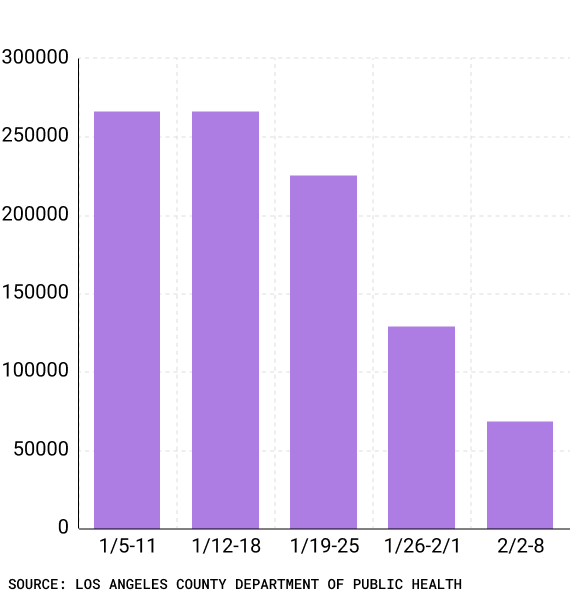
The daily average case rate from Feb. 1-7 fell to 102 positive cases per 100,000 residents, a 47% decline from the 193 cases the previous week.
The daily test positivity rate also continues to tumble. It dipped to 5% on Monday, the lowest level since Dec. 21. The rate was again 5% on Wednesday.
COVID-19 positivity rate in Los Angeles County, Nov. 15-Feb. 8
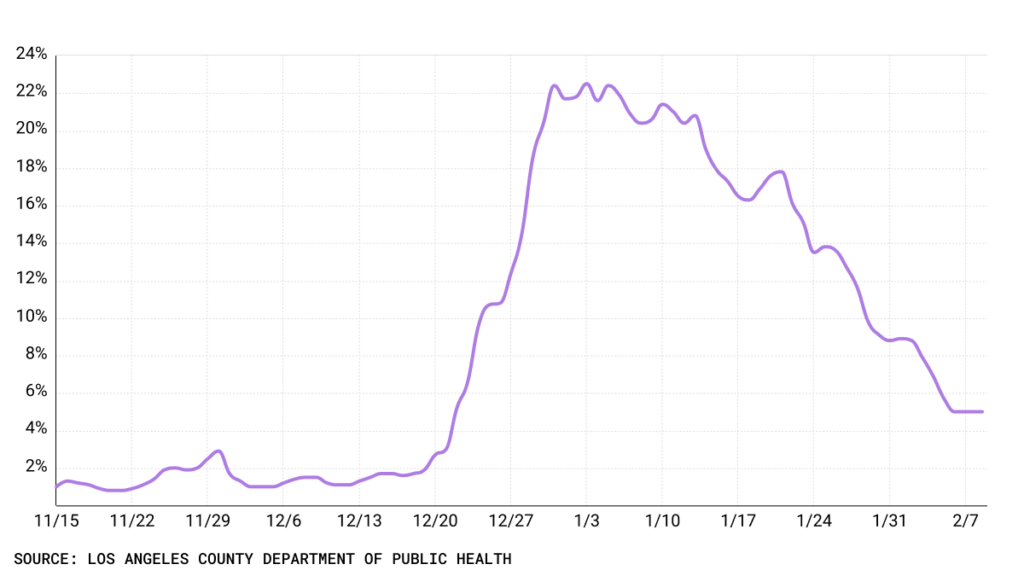
The Los Angeles Unified School District, which has long had a robust testing system and masking policy, is also seeing a decline in test positivity. From Feb. 2-8, 329,504 tests were given to students and staff. With 7,320 positive results, positivity was 2.22%, down from 3.86% the previous week.
[Get COVID-19, crime and other stats about where you live with the Crosstown Neighborhood Newsletter]
Fewer hospitalizations, more deaths
As overall conditions improve, hospitalizations have steadily declined. On Wednesday, 2,597 county residents were hospitalized with the coronavirus, a 26.1% decrease from the previous week. This time last year, there were 4,079 COVID-19 patients in area hospitals.
COVID-19 hospitalizations in Los Angeles County
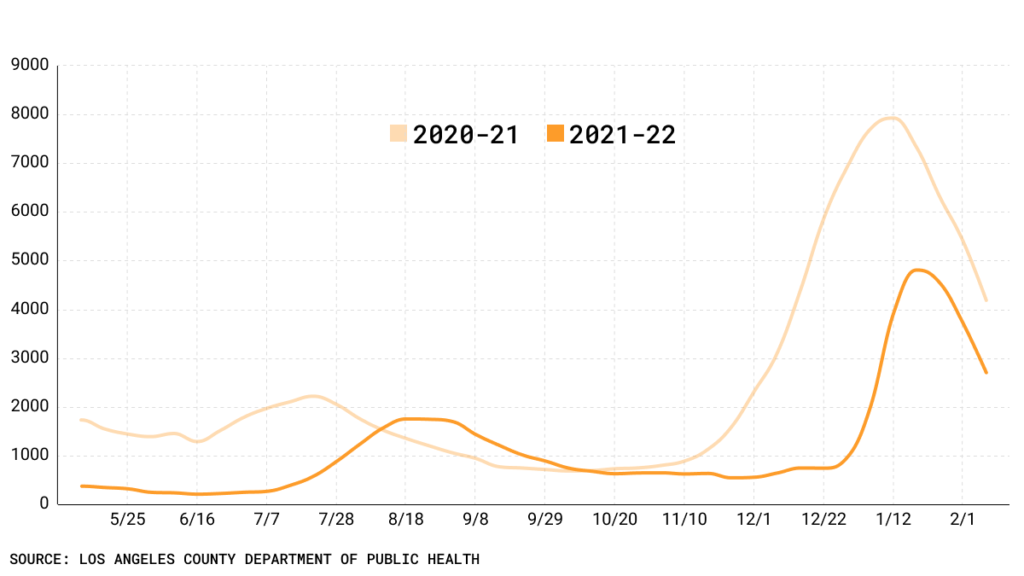
From Feb. 1-7, the seven-day average of daily hospital admissions fell to 310, a 26% decline from the week before.
Yet for all the positive indicators, there remains a dark cloud—COVID-19 deaths continue to be at uncomfortably high levels. On Wednesday the county reported 103 fatalities, the highest daily tally since March. The seven-day average of deaths on Wednesday was 73.
Weekly COVID-19 deaths in Los Angeles County, Jan. 6-Feb. 9
![]()
Still, the figures are relative. On Feb. 9, 2021, the seven-day average of deaths was 189.
Delivering doses
As discussions of easing an indoor mask mandate grow more frequent, experts stress that inoculations continue to provide the best protection. According to the state of California’s COVID-19 tracking page, from Jan. 10-16, unvaccinated people were 7.5 times more likely to get COVID-19 than those who had gotten shots. The unvaccinated were also 14.9 times more likely to be hospitalized.
From Jan. 9-15, unvaccinated residents in Los Angeles County were 12 times more likely to die from the virus than vaccinated individuals.
Through Feb. 3, 81.7% of Los Angeles County residents 5 and up, or about 7.95 million people, had received at least one dose of the vaccine. Nearly 73% are fully vaccinated and 3.36 million have been boosted.
Within the last seven days, 194,307 shots were administered, down from 341,519 the week before. Nearly 42,000 of the shots given over the past week were second doses. Altogether, 17,509,580 shots have been administered in Los Angeles County.
How we did it: We analyzed coronavirus data related to new cases, deaths, hospitalizations and vaccinations provided by the Los Angeles County Department of Public Health, as well as data from the Los Angeles Unified School District.
Interested in our data? Check out the Crosstown coronavirus interactive map or email askus@xtown.la.


