The Crosstown COVID Tracker
![]()
More than two years after a pandemic was declared, Los Angeles County continues to see two divergent COVID-19 trends: rising cases, and near-record low hospitalizations and deaths.
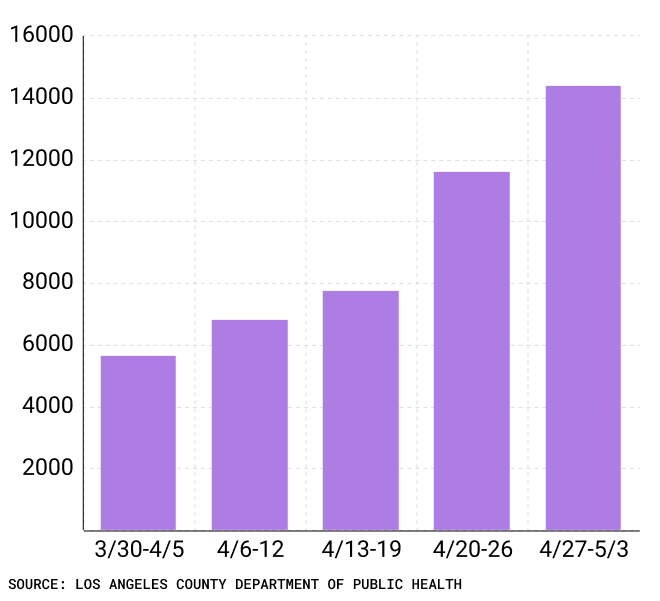
For more than a month, cases have been increasing due to the highly contagious Omicron BA.2 subvariant (though the situation is nothing close to the January surge). On Saturday, the Los Angeles County Department of Public Health identified 2,728 new cases, the highest figure since Feb. 21.
The seven-day average of cases on Wednesday hit 2,168. The average had not surpassed 2,000 since Feb. 26. This week’s average is a 25% increase from last week.
Weekly COVID-19 cases in Los Angeles County, March 30-May 3

The BA.2 subvariant is the dominant strain nationally. However, there is concern that a newly identified strain, BA.2.12.1, could quickly spread. It is estimated to be up to 30% more contagious than BA.2
The Crosstown COVID Tracker provides the latest and most important data on infections, inoculations and general risk. Information on cases in individual communities is available on the Crosstown coronavirus interactive map.
Deaths in single digits
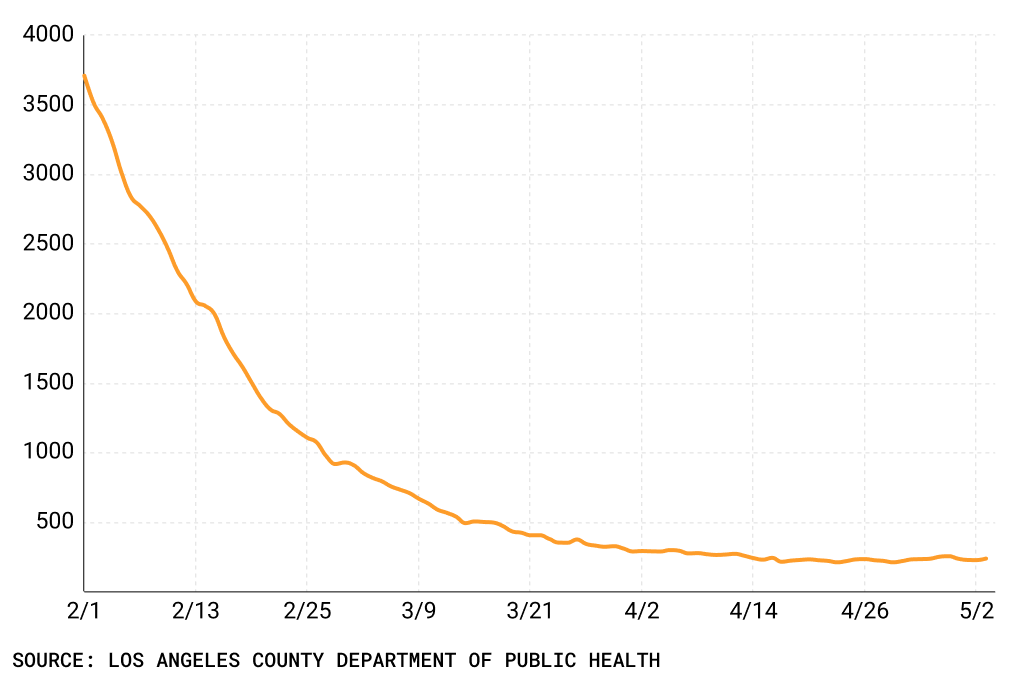
While health officials are eyeing the new variants, they also take hope in the reduced strain on the medical system. Following the January surge, hospitalizations have fallen dramatically, and have remained below 300 since April 1. That is a level not seen since the early months of the pandemic.
There were 248 County inhabitants being treated in hospitals on Wednesday. That’s a 5.5% increase from the week prior.
COVID-19 hospitalizations in Los Angeles County, Feb. 1-May 3

COVID-19 fatalities also remain exceptionally low. On Sunday, the seven-day average of deaths dropped to 5. In early February, there were sometimes more than 100 deaths a day.
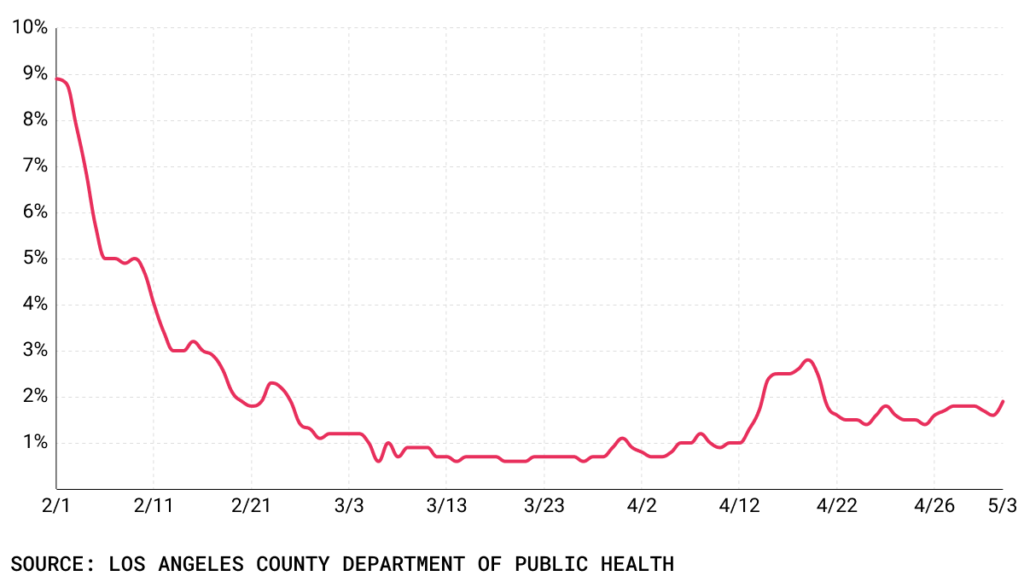
The daily test positivity rate remained below 2% this week, though as with cases, this may be an undercount due to the prevalence of at-home testing. The rate was 2.2% on Wednesday.
Four months ago, on Jan. 5, 12.7% of tests were coming back positive.
COVID-19 positivity rate in Los Angeles County, Feb. 1-May 3

Cases are increasing on Los Angeles Unified School District campuses. From April 28-May 4, there were 1,569 positive results out of 345,907 tests administered. The positivity rate this week was 0.45%, up from the 0.39% reported the previous week.
The Department of Public Health continues to make COVID-19 vaccines accessible on school campuses. There are 744 school-based vaccine clinics scheduled in Los Angeles County this month.
[Get COVID-19, crime and other stats about where you live with the Crosstown Neighborhood Newsletter]
Jabs at a trickle
Despite rising concern over BA.2, vaccine rates have made little headway for more than a month.
During the past week, just over 85,000 vaccinations were administered to county residents, and 8,035 were second doses. This is significantly lower than the 38,108 second doses that went into arms from Dec. 30-Jan. 6.
Of 9.7 million eligible County residents, 1.5 million are unvaccinated. Only 3.8 million have been boosted, according to the Department of Public Health.
The vaccination rate for Angelenos 5 and up remains unchanged from last week. Through April 28, 83.4% of this sector had gotten at least one jab, and nearly 75% were fully vaccinated.
Vaccines have time and time again proven to be highly effective at preventing serious illness and death. From April 4-10, unvaccinated California residents were 5.7 times more likely to contract the virus than their vaccinated counterparts, according to the state’s COVID-19 tracking page. Additionally, unvaccinated individuals were 8.6 times more likely to be hospitalized than those who are fully protected.
Approximately 18,606,227 vaccine doses have been administered in Los Angeles County. The number of shots dispensed this time last year was 7,862,893.
How we did it: We analyzed coronavirus data related to new cases, deaths, hospitalizations and vaccinations provided by the Los Angeles County Department of Public Health, as well as data from the Los Angeles Unified School District.
Interested in our data? Check out the Crosstown coronavirus interactive map or email askus@xtown.la.


