

The Crosstown COVID Tracker


COVID-19 may not be surging in Los Angeles County, but there is definitely a wave spreading across the region. This week, the Department of Public Health reported the highest number of new cases since Feb. 18.
Hospitalizations and the positivity rate are also beginning to climb. Attribute the increases to the BA.2 subvariant and its lineages, which account for nearly 97% of cases.
The Crosstown COVID Tracker provides the latest and most important data on infections, inoculations and general risk. Information on cases in individual communities is available on the Crosstown coronavirus interactive map.
Climbing the charts
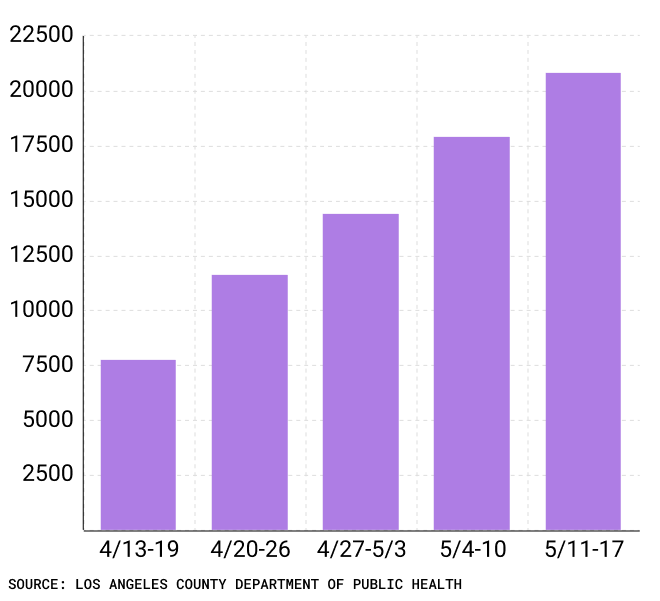
On Wednesday, there were 4,384 new cases reported, a level not reached in three months. That brought the seven-day average to 3,169. One month ago, the average stood at 1,098.
Weekly COVID-19 cases in Los Angeles County, April 13-May 17
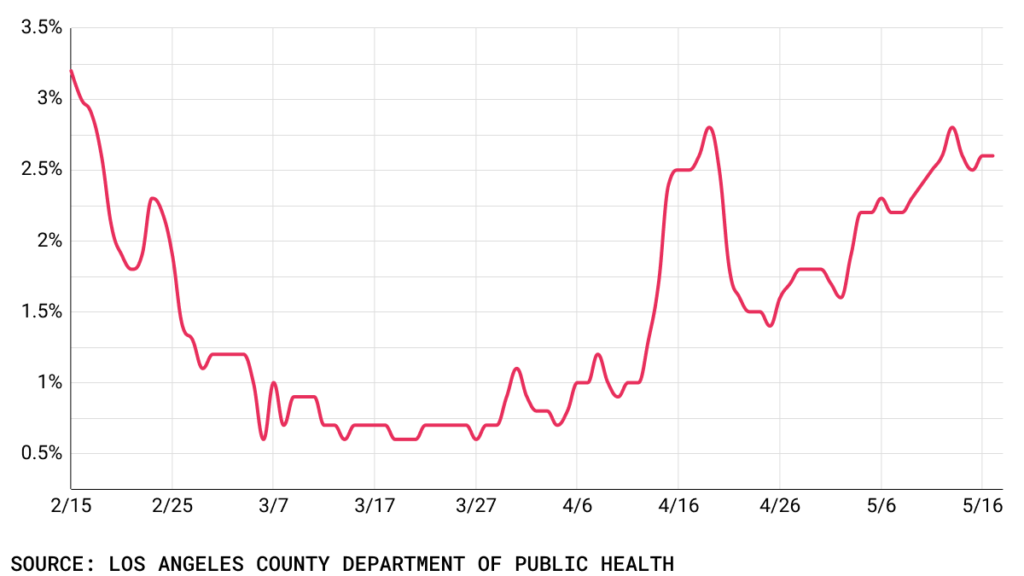
In early April, the positivity rate was below 1%. It then began climbing, and although it remains far below the double-digit rates recorded early in the year, 3.2% of tests administered came back positive on Wednesday.
COVID-19 positivity rate in Los Angeles County, Feb. 15-May 17
The Los Angeles Unified School District continues to see a similar pattern, as this is the sixth consecutive week cases at area schools have increased. There were 3,260 positive results out of the 451,265 tests given from May 11-17. This week’s positivity rate reached 0.72%, up from 0.53% last week.
Lagging metrics catch up
After weeks of low counts, more people with COVID-19 are being treated in area hospitals. This continues a trend seen in previous waves, with the number of individuals who require high-level medical care rising weeks or a month after cases start to spike.
Saturday was the first time since March 31 that there were more than 300 COVID-positive patients in local hospitals. On Wednesday 363 people were hospitalized. One month ago there were 221 hospitalizations.
COVID-19 hospitalizations in Los Angeles County, Feb. 15-May 17

COVID-19 deaths remain stable and have slightly decreased since last month. This is in part because deaths typically lag hospitalizations by several weeks. More effective treatment options such as antivirals have also helped reduce fatalities.
There were 10 new deaths reported Wednesday, bringing the seven-day average to 7.
[Get COVID-19, crime and other stats about where you live with the Crosstown Neighborhood Newsletter]
Unvaccinated county residents were five times more likely to be hospitalized than their fully vaccinated counterparts as of April 22. The likelihood of dying was 16 times higher for unvaccinated individuals compared with those who are fully protected.
Prevention and Protection
Although vaccines protect against COVID-19 and its subvariants, some effectiveness wears off over time. Health officials continue to stress the importance of getting two shots and then a booster.
A recent study by the University of San Francisco and the California Department of Public Health found that, for a 10-month period starting when vaccines became available, and ending on Oct, 16, 2021, the shots prevented more than 1.5 million COVID-19 infections in the state. Additionally, the study stated that vaccinations prevented 72,000 hospitalizations and 19,000 fatalities.
Yet not everyone remains convinced of the efficacy. Nearly 16.4% of eligible county residents 5 and up were unvaccinated as of May 12. More than 7.36 million individuals are fully vaccinated, though only 3.92 million have received a booster dose.
In Los Angeles County, there have been 18,807,938 vaccine doses administered. One year ago this week, 9,113,124 shots had gone into arms.
How we did it: We analyzed coronavirus data related to new cases, deaths, hospitalizations and vaccinations provided by the Los Angeles County Department of Public Health, as well as data from the Los Angeles Unified School District.
Interested in our data? Check out the Crosstown coronavirus interactive map or email askus@xtown.la.


