

The Crosstown COVID Tracker


![]()
For the ninth consecutive week, the number of new COVID-19 cases identified in Los Angeles County has gone up. This week, the Department of Public Health reported the highest number of infections since Feb. 13.
The prime drivers of new cases continue to be the BA.2 subvariant’s high transmission rate and the large number of end-of-school-year events. Recommendations to continue masking indoors and getting a COVID-19 test prior to large gatherings have done little to slow the trend.
The Crosstown COVID Tracker provides the latest and most important data on infections, inoculations and general risk. Information on cases in individual communities is available on the Crosstown coronavirus interactive map.
Infection detection
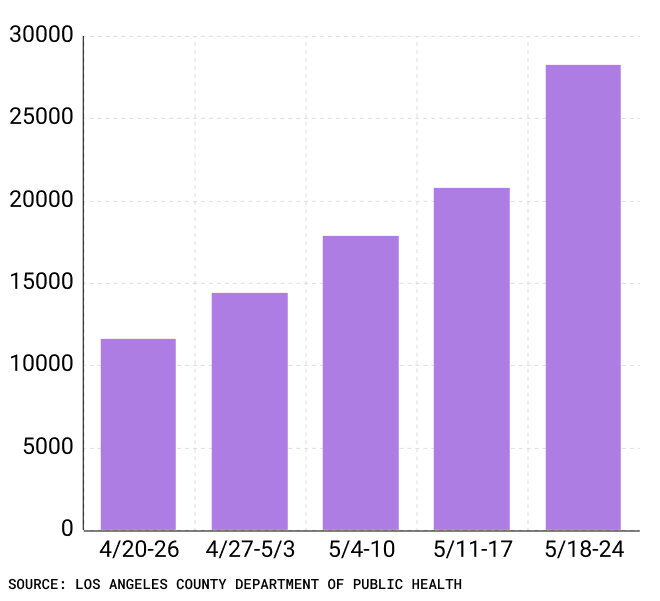
On Wednesday, the seven-day average of new cases hit 4,011, a level not seen for three months. That represents a 26.6% increase from the average reported one week prior.
Weekly COVID-19 cases in Los Angeles County, April 20-May 24
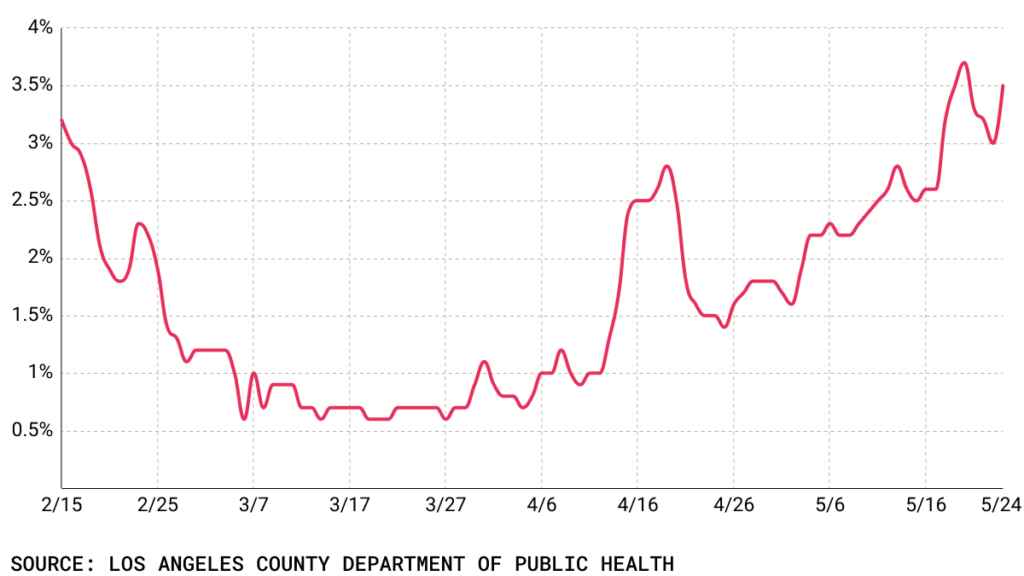
The daily test positivity rate also continues to trend up. It reached 3.8% on Wednesday. Three months ago, the positivity rate stood at 1.9%.
COVID-19 positivity rate in Los Angeles County, Feb. 15-May 24
While the rise in cases and positivity are sparking concern, the numbers remain far below what they were during the January Omicron surge, and in previous surges. Additionally, the strain on the regional healthcare system remains relatively low.
On Wednesday, the Department of Public Health reported 410 COVID-19 hospitalizations in the county. That is less than 10% of the 4,814 coronavirus patients who were hospitalized on Jan. 28, the height of the Omicron wave.
Vaccinations and boosters have prevented many people who get sick from needing to go to the hospital. Additionally, treatments including antivirals can help reduce the severity of an infection.
COVID-19 hospitalizations in Los Angeles County, Feb. 15-May 24
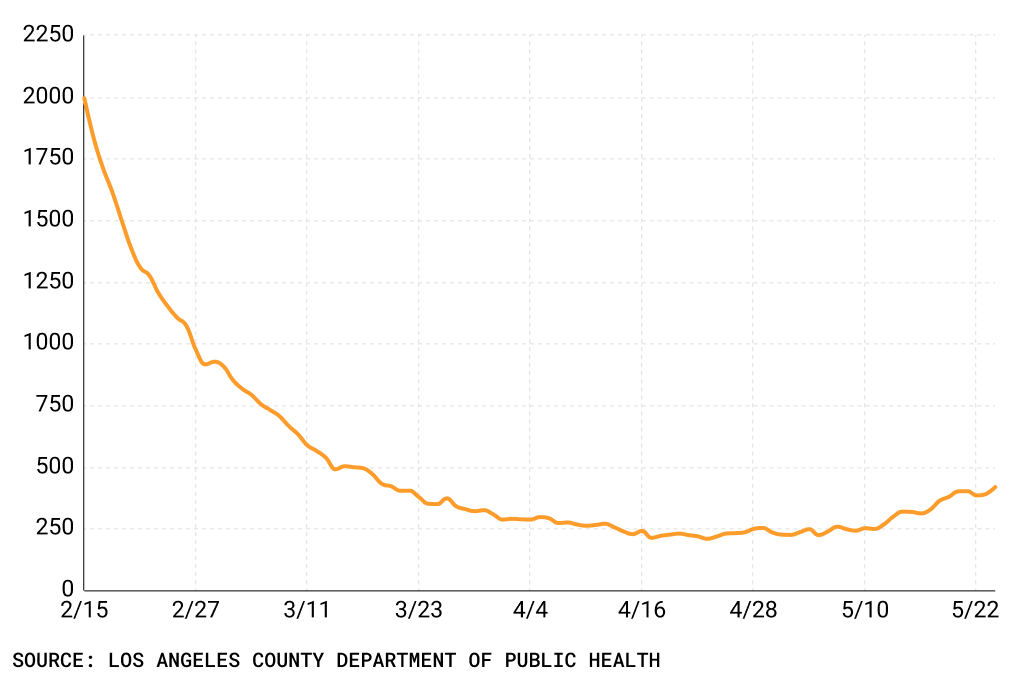
Still, the number of hospitalizations has ticked up from recent lows. Throughout April, there were fewer than 300 county inhabitants receiving hospital care.
Deaths also remain at levels not seen since the early days of the pandemic. On Wednesday, the Department of Public Health reported 6 fatalities, bringing the seven-day average of deaths to 7.
Like the region at large, the Los Angeles United School District has seen increases in both cases and test positivity, though once again, they remain relatively low. From May 19-25, the LAUSD identified 3,352 positive results out of the 352,390 tests administered. The positive test rate was 0.95%, up from 0.72% last week.
The LAUSD academic year ends in June.
All about the kids
The number of new or additional vaccinations dispensed across Los Angeles County remains low, despite continued efforts to get people to take the jab.
As of May 19, nearly 1.6 million county residents 5 and up had not received a single dose. More than 3.4 million individuals do not reap the benefits from the protection of the booster shot.
[Get COVID-19, crime and other stats about where you live with the Crosstown Neighborhood Newsletter]
According to the state of California’s COVID-19 tracking page, for the week ending May 1, unvaccinated county residents were 7.4 times more likely to be hospitalized than fully vaccinated and boosted individuals. From April 18-24, unvaccinated residents were 9.1 times more likely to die compared with those who had been boosted.
In Los Angeles County, 37.9% of children ages 5-11 have received at least one dose. The Centers for Disease Control and Prevention last week approved boosters for kids in this age range.
There have been 18,897,204 vaccine doses administered in Los Angeles County. One year ago, 9,501,064 vaccines had been distributed.
How we did it: We analyzed coronavirus data related to new cases, deaths, hospitalizations and vaccinations provided by the Los Angeles County Department of Public Health, as well as data from the Los Angeles Unified School District.
Interested in our data? Check out the Crosstown coronavirus interactive map or email askus@xtown.la.


