

Road rage is soaring in Los Angeles


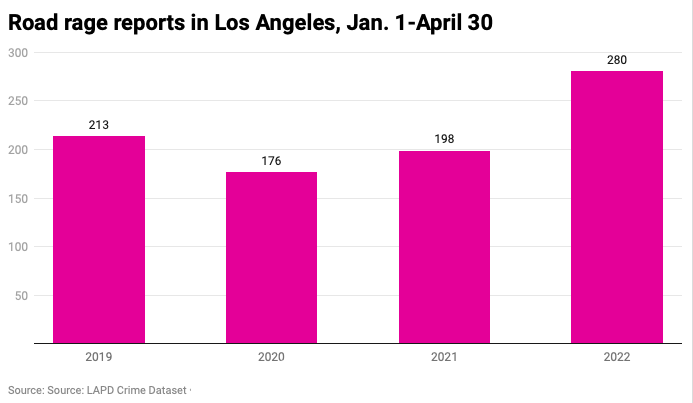
If the streets of Los Angeles seem more confrontational than in the past, there’s a reason: Reports of road rage in the city have spiked 41.4% in the first four months of the year compared with the same timeframe in 2021. Not only that, a rising number of incidents involve firearms.
According to publicly available Los Angeles Police Department data, there were 280 road rage reports on city streets from Jan. 1-April 30, up from 198 in that period last year. During the same months in the pre-pandemic year of 2019, there were 213 cases of road rage.
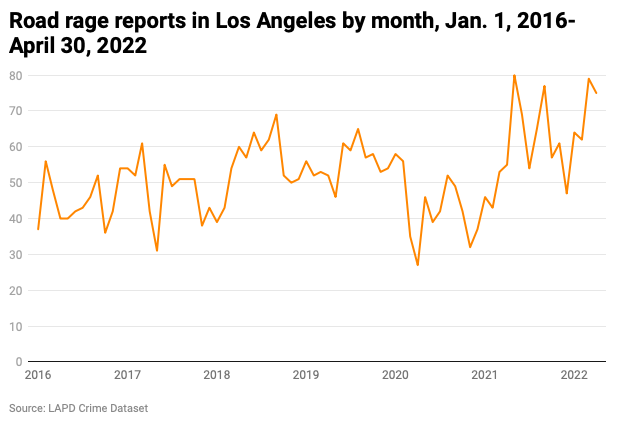
The difference before and after the pandemic has been striking. From 2016 to 2020, there were often in the vicinity of 40 to 60 monthly road rage reports. The confrontations tumbled after the onset of the coronavirus, then began to spike last spring. In May 2021 the LAPD recorded 80 road rage reports, the highest monthly figure ever.
Three times since then there have been more than 70 reports, including 79 in March and 75 in April. That represents the highest two-month total ever in Los Angeles, according to LAPD data.
James Moore, director of the USC Transportation Engineering Program, attributes the increase in road rage to the lingering effects of the pandemic, with economic woes and other issues impacting the psyche of Angelenos who need to get somewhere.
“Drivers are responding adversely to the elevated stress we are all feeling,” said Moore. “People who are frightened, frustrated and feeling less accountable may behave less well.”
Criminal matter
While the concept of road rage makes some think of a driver who gets cut off and responds by shaking a fist, actual incidents are much more serious. The LAPD defines road rage as when a person commits an assault with a vehicle, or other weapon, due to something that occurs while driving. To be classified as road rage, the encounter must, in police parlance, require “willful and wanton disregard for the safety of others.”
[Get COVID-19, crime and other stats about where you live with the Crosstown Neighborhood Newsletter]
Los Angeles is not alone in seeing more angry and dangerous drivers. Everytown for Gun Safety, a nonprofit that works to prevent violence associated with firearms, issued a report detailing a nationwide rise in gun-related road rage. It found that incidents in the United States have increased every year since 2018, and that in 2021 an average of 44 people per month were shot, and either killed or wounded, in road rage encounters. That is more than double the pre-pandemic average.
That trend has been felt in Los Angeles. Last year, according to LAPD data, 138 road rage incidents involved handguns. That is a 123% increase from the year before. In 2019, 61 road rage reports involved a gun.
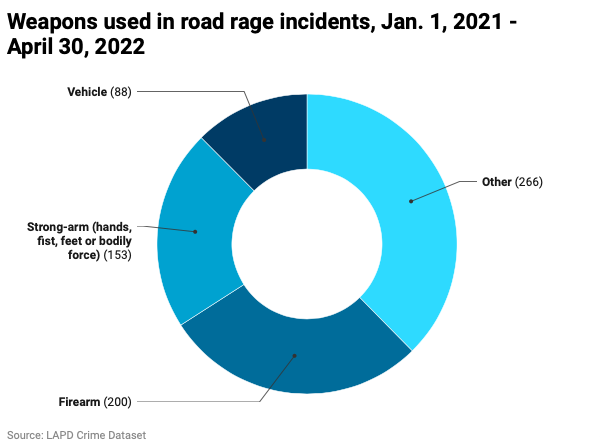
The LAPD lists the most commonly utilized road rage weapon in the last three years as bodily force. A car itself is also sometimes classified as a weapon.
From Jan. 1, 2021-May 15, 2022, there were 72 road rage reports in traffic-clogged Downtown, more than any other community in the city. Venice recorded the second-highest number of incidents, with 36. There were 34 reports in Koreatown.
Men are overwhelmingly involved in road rage. Of the 280 incidents this year, 197 involved a male suspect, compared with 77 calls about a female suspect (in six cases the gender was unknown).
How we did it: We examined publicly available crime data from the Los Angeles Police Department from Jan. 1, 2012-May 15, 2022. Learn more about our data here.
LAPD data only reflects crimes that are reported to the department, not how many crimes actually occurred. In making our calculations, we rely on the data the LAPD makes publicly available. LAPD may update past crime reports with new information, or recategorize past reports. Those revised reports do not always automatically become part of the public database.
Have questions about our data or want to know more? Write to us at askus@xtown.la.


