As traffic decreased in Los Angeles, so did road rage

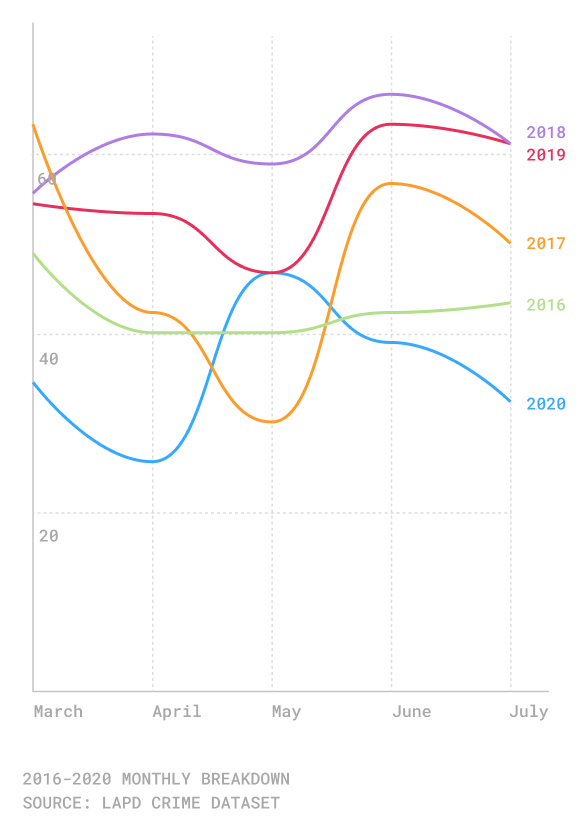
The number of road rage incidents in the City of Los Angeles has dropped during the time of the coronavirus. According to LAPD data, from March 1-July 31 there were 33.5% fewer incidents of road rage, with 180 reports, down from 271 in the same time frame last year.
Traffic decreased substantially throughout the city in mid-March, when Mayor Eric Garcetti ordered all non-essential businesses to close in the effort to halt the spread of COVID-19. A Crosstown analysis found that even as the economy began to slowly reopen two months later, car volume remained low, as many people were out of work, were working from home or simply were not driving for errands or to socialize.
The 35 road rage incidents in March were down significantly from the 53 in the same month last year. The decline has been mostly consistent, with at least 22 fewer incidents than in each similar month in 2019. The lone exception was May, when the 46 incidents equaled last year’s figure.
Road rage reports have dropped since then, with 39 incidents in June, according to the LAPD, and 33 in July.
Annual road rage reports from March-July

Although there are varying degrees of severity of road rage, the consequences can be serious.
According to police data, at 9:30 p.m. on March 30, a suspect forced his way into a 26-year-old woman’s car on the 500 block of N. Ardmore Ave. in East Hollywood. A police report said the woman was a victim of battery simple assault.
Another incident occurred at 2 p.m. on June 16 at the intersection of W. Pico Blvd. and S. Alvarado St. in Pico-Union. According to a police report, multiple people attacked a 19-year-old man in a parking lot. The victim was attacked from the rear and knocked to the ground. He was spit on and the assailants vandalized his car.
These examples are not unusual. According to police data, assault was a component of road rage incidents 63% of the time. In 10.5% of the incidents, an individual’s car was vandalized.
Downtown incidents
The recent drop in road rage incidents also marks a shift from a year ago. Last September a Crosstown analysis found that road rage incidents slightly increased during the first eight months of 2019. In 36% of those instances people were also victims of assault.
The 180 road rage incidents from March through July of this year is the lowest level in at least five years. The highest recent year-end tally was in 2018, when 294 road rage reports were taken.
The most frequent day for road rage incidents in the last five months was Monday, followed by Sunday. Last year the highest number of incidents occurred on Friday.
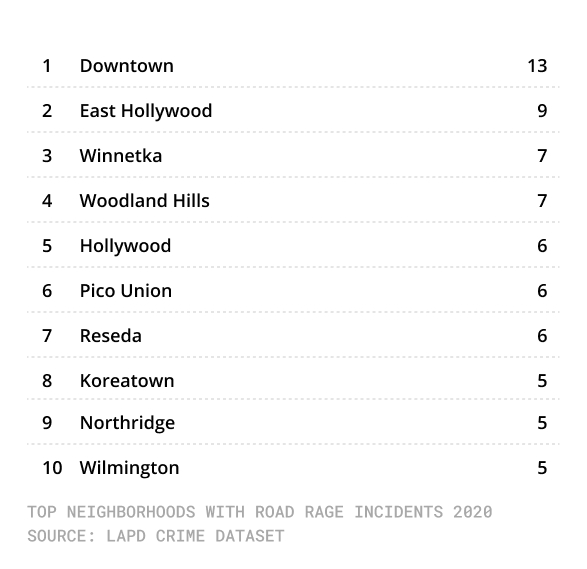
Neighborhoods with most road rage incidents from March-July

Streets in Downtown, which even amid the widespread business closures is still a heavily populated commercial area, were the site of 13 road rage incidents from March-July, the most of any local community. The neighborhood with the second highest number of incidents, nine, was East Hollywood.
If you are venturing out more often as things begin to open back up, try not to be the person who experienced so much road rage, they intentionally crashed their car into another vehicle, as one Twitter user witnessed.
How we did it: We examined LAPD publicly available data on reported crimes that involved road rage from March 1 – July 31 this year compared with the same time last year. For neighborhood boundaries, we rely on the borders defined by the Los Angeles Times. Learn more about our data here.
LAPD data only reflect crimes that are reported to the department, not how many crimes actually occurred. In making our calculations, we rely on the data the LAPD makes publicly available. On occasion, LAPD may update past crime reports with new information, or recategorize past reports. Those revised reports do not always automatically become part of the public database.
Want to know how your neighborhood fares? Or simply just interested in our data? Email us at askus@xtown.la.


