What 3 million Los Angeles County COVID-19 cases look like

In March 2020, the novel coronavirus began spreading quickly in Los Angeles and around the world. There have been advances and backsliding ever since, from protections provided by masking and readily available vaccines, to surges propelled by subvariants.
Although much of the region now functions as it did before the pandemic, there are markers that remind of the threats of COVID-19. One of those occurred on June 5: The Los Angeles County Department of Public Health that day reported surpassing 3 million coronavirus cases in the region.
The actual count is undoubtedly higher, as some early cases were never chronicled due to a lack of testing, and more recently, many people who test positive with home kits do not report their status to health officials.
Still, the County Department of Public Health’s publicly available COVID-19 data allows a glimpse of the virus’ uneven march across the region over the course of 27 months. Here is how the area has been impacted.
Hitting cities
The city of Los Angeles, with 4 million residents, is the largest of L.A. County’s 88 cities. So it is no surprise that the 1,251,012 identified cases as of June 8 is more than any other city. According to the Department of Public Health, the case rate is 30,930 infections per 100,000 residents.
The city with the second-greatest number of cases is Santa Clarita, with 57,897; that works out to a case rate of 26,445 per 100,000 inhabitants. Palmdale recorded the third-highest overall tally, with 54,749 cases. Its case rate is 34,595 per 100,000 residents.
The neighborhood in the city of Los Angeles that recorded the most infections is North Hollywood, with 49,003 cases as of June 9. The second-highest number of cases was detected in Boyle Heights (34,404).
[Get COVID-19, crime and other stats about where you live with the Crosstown Neighborhood Newsletter]
Many of the most-impacted communities in the city are in the San Fernando Valley or South Los Angeles. Pacoima registered the highest case rate, with 43,231 infections per 100,000 residents. Vernon Central has a case rate of 42,905 per 100,000 inhabitants. (Neighborhood figures do not include communities with correctional facilities, where numbers are sometimes higher.)
Gender gap
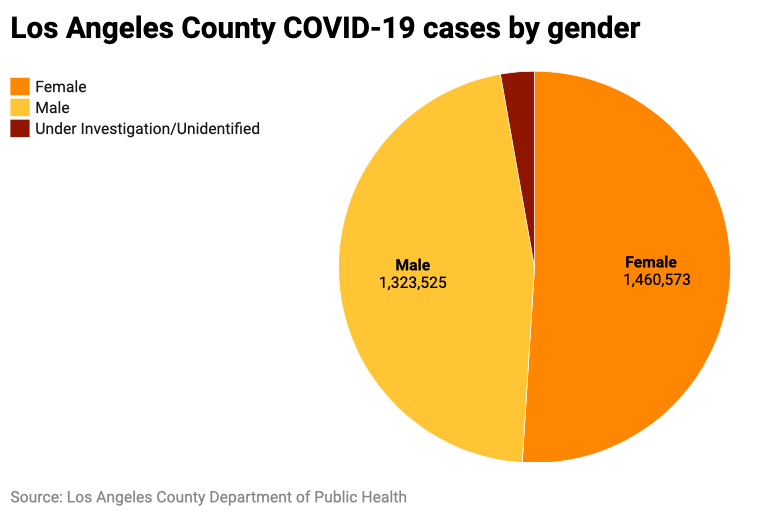
COVID-19 case numbers in the region are higher in women than men. This gender difference began early in the pandemic, and has continued.

In Los Angeles County as of June 9, about 1.46 million cases were diagnosed in women or girls, compared with 1.3 million in men or boys. (The gender in some cases has not been identified. The overall figures do not add up to 3 million because some cases were diagnosed in Pasadena or Long Beach, which each have their own health department. The L.A. County data does not include their gender breakdowns.)
Age disparities
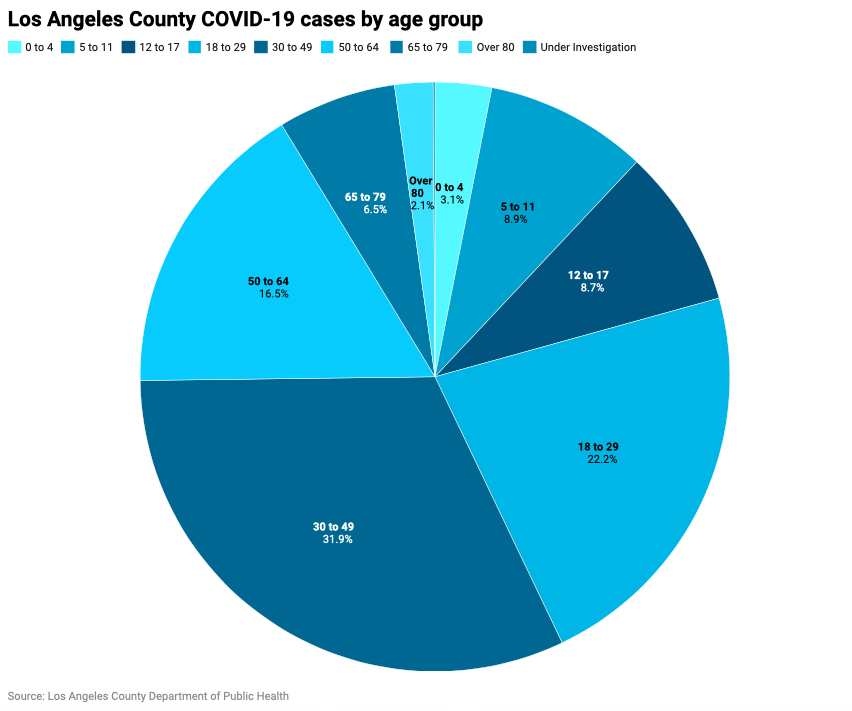
The Department of Public Health breaks cases into eight age groups. In the early days of the pandemic, there were particular worries about the impacts on seniors, who were most vulnerable to suffering severe complications or dying from COVID-19. Two years in, 244,788 cases in L.A. County have been identified in people 65 and over. That is 8.6% of the total.
The age group with the greatest number of cases as of June 5 is people 30-49. The 908,249 cases represents 31.9% of the total. This slightly exceeds their representation, as 29.9% of the county’s population is 30-49.

There were 632,552 cases identified among people 18-29. This accounts for 22.2% of the cases in the county.
Inequitable spread
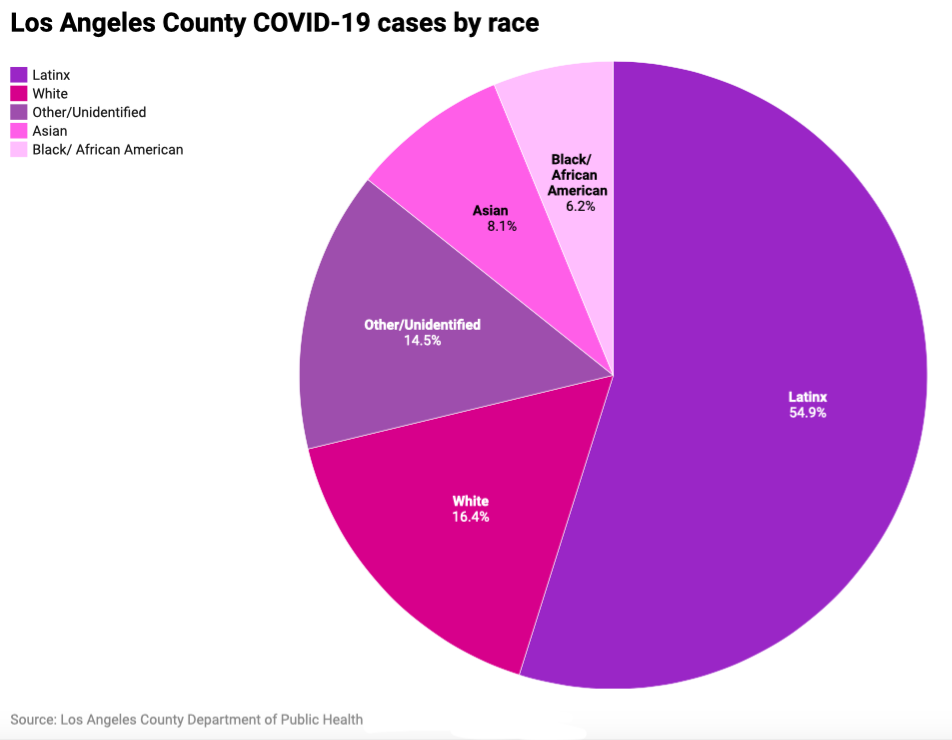
Since the early days of the pandemic, Black and Latinx Angelenos have contracted and died of COVID-19 at much higher rates than white and Asian people in the region. The difference has been largely attributed to income and employment, with higher numbers of Black and Latinx people in the county working in essential positions where telecommuting was not an option. Higher case rates in these communities was also often driven by more people living in a single household, allowing for faster spread.

Latinx residents account for nearly 48.1% of Los Angeles County’s population. Yet 1,276,921 cases have been identified in Latinx individuals, representing 54.9% of coronavirus cases in the region where race or ethnicity have been specified (that is unclear or has not been determined in more than 500,000 cases).
At the other end of the spectrum are Asian residents of L.A. county. Although 14.1% of the population is of Asian descent, the community recorded just 8.1% of COVID-19 cases.
Deaths and hospitalizations
Out of the 3,038,588 COVID-19 confirmed cases in Los Angeles County, there have been 32,218 fatalities. Nearly 1.1% of people who have contracted COVID-19 in the region have died.
More than 140,000 people in the county have been hospitalized with COVID-19 since the start of the pandemic. An estimated 4.9% of those who contracted the coronavirus required hospitalization.
Since the early days of the pandemic, there has been a high level of concern about the virus’ potential to course through the community of people experiencing homelessness. The most recent Homeless Count put the population of unhoused Angelenos at just over 66,000.
As of June 4, there were 18,824 confirmed COVID-19 cases among people experiencing homelessness in the county. According to the Department of Public Health, 351 people experiencing homelessness have died.
How we did it: We analyzed coronavirus data related to cases, deaths and hospitalizations provided by the Los Angeles County Department of Public Health from March 2020–May 31, 2022. Some information may have been updated later and may not be reflected in this story.
Interested in our data? Check out the Crosstown coronavirus interactive map or email askus@xtown.la.


