

The Month in COVID: May


COVID-19 has been part of life for more than two years now. Perhaps the most consistent thing about the virus is how inconsistent and unpredictable it is: Case numbers rise and fall. Life in Los Angeles seems to return to normal, and then variants emerge and threaten progress.
To track some of the greater trends, and complement the weekly COVID Tracker, Crosstown is launching The Month in COVID. At the end of each month, we’ll look at what has changed and where things are going in terms of infections, hospitalizations, health recommendations and more. Here is how the situation looked in May.
The big picture
The BA.2 subvariant spread rapidly in May. Other subvariants, such as BA.2.12.1 and BA.2.3, produced additional infections. That prompted repeated warnings from the Los Angeles County Department of Public Health and other agencies.
Progress from March fell away, and case numbers that remained stable throughout April were a thing of the past. The Department of Public Health recorded 103,107 new cases in May, a 159.5% increase over the previous month.
Monthly COVID-19 cases in Los Angeles County, January-May
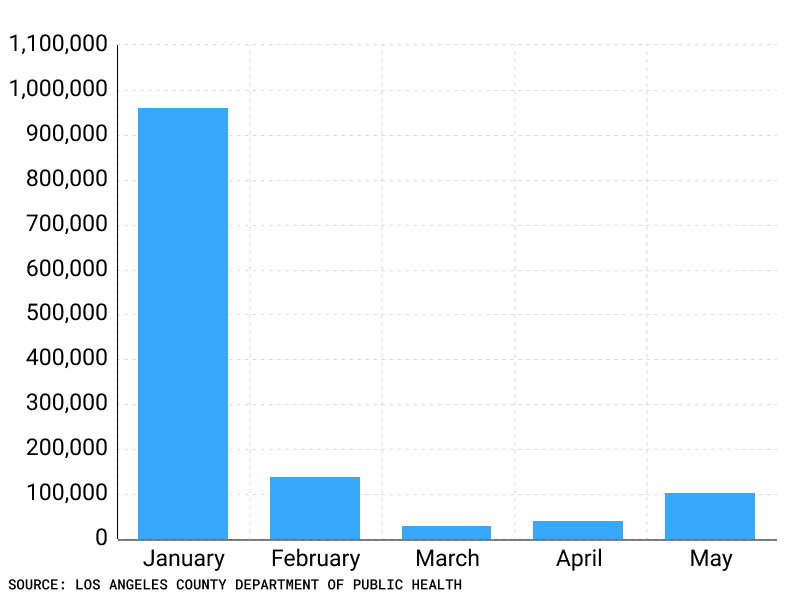
The monthly average of cases during May was 3,326. The highest number of new cases reported in a day was 6,245 on May 26. The lowest was 1,368 on May 2.
Although the local situation worsened, Los Angeles County fared better than some other places, such as New York City.

Positivity rate and hospitalizations
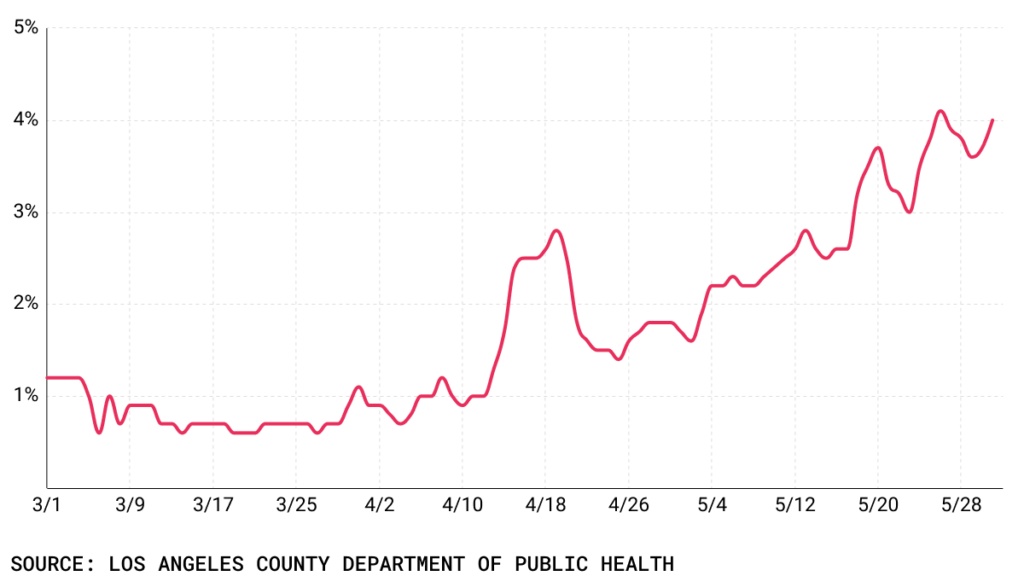
For more than two months, the test positivity rate in L.A. County had been below 3%. That changed in May.
The seven-day average positivity rate on the final day of the month was 4%. That is more than double what it was a few weeks before. On May 1 the rate was 1.7%.
The positivity rate remained above 3.5% the entire last week of the month. Yet that was a relatively modest figure—in January the positivity rate was consistently above 10%.
COVID-19 positivity rate in Los Angeles County, March 1-May 31
Hospitalizations also increased during May, and while the percentage jump from April was high, again, figures are below what they were during previous surges.
On May 1, 226 people in L.A. County were hospitalized with COVID-19. That would be a low point. By the middle of the month the patient load was over 300, and on May 31, 479 patients were receiving treatment.
COVID-19 hospitalizations in Los Angeles County, March 1-May 31
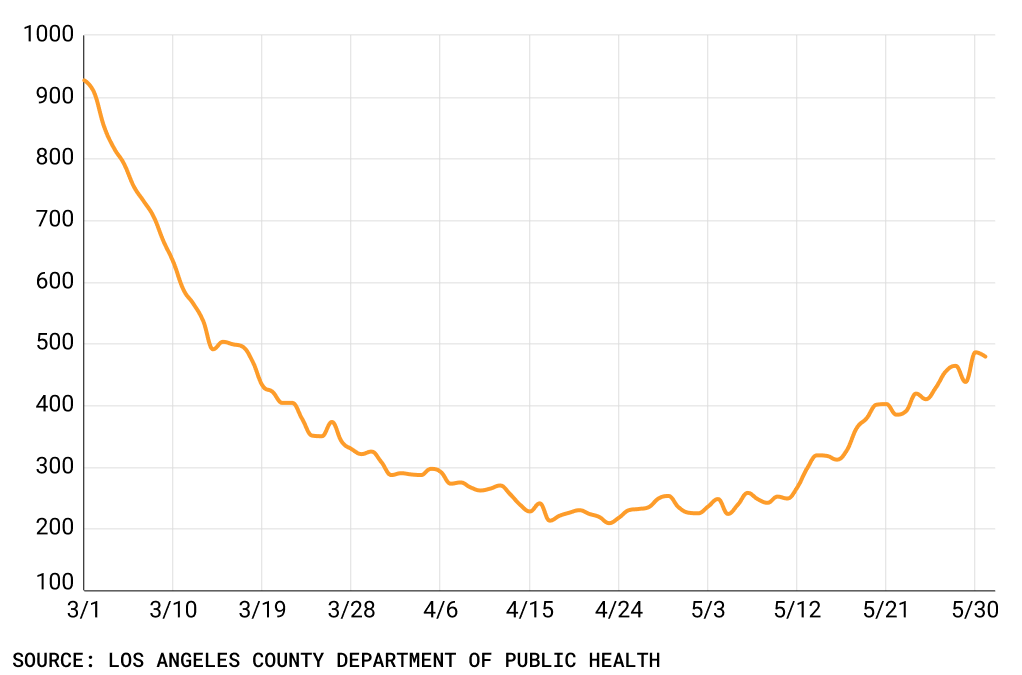
The average daily number of hospitalizations in May was 335. In January, the average was 3,755.
As has been the case since the earliest days of the pandemic, senior citizens are more likely to be hospitalized than younger people. The number of older Angelenos seeking high-level medical treatment spiked during May.
According to the Department of Public Health, the COVID-19 hospitalization rate for Angelenos 80 and up was 37 per 100,000 people on April 23. One month later, the rate for this group reached 67 per 100,000. That’s an 82% increase.
Deaths
The most difficult part of COVID-19 remains the loss of life. Los Angeles County reached another unsettling barrier this month: On May 10, the region recorded more than 32,000 deaths.
A ray of light was that the region saw the death rate fall to levels not seen since the earliest days of the pandemic. Approximately 165 people died of COVID-19 in May; there were never more than 10 fatalities in a single day.
By contrast, in January there were approximately 1,285 COVID-19 fatalities in the county.
[Get COVID-19, crime and other stats about where you live with the Crosstown Neighborhood Newsletter]
Vaccinations
There were advances on the inoculation front during May, but ultimately, little overall progress in community protection. Clearly, a sizable number of Angelenos have decided not to get vaccinated.
The CDC in May approved a single dose of a booster shot for kids ages 5-11. By the end of the month, 1,083 had received the extra jab.
COVID-19 vaccinations in Los Angeles County for kids 5-11
Vaccination rates were overwhelmingly low in Los Angeles County during the month. From May 1-29 (the most recent day data is available), 415,506 shots went into arms. That’s a 64.9% decrease from the 1,182,883 shots administered in the same time period in January.
During the month, 45,820 second doses were given out, and 112,609 booster shots were administered.
Despite overall slow progress, there was an advance for some of the region’s most vulnerable: From May 1-29, 9,351 kids ages 5-11 received a second jab. Nearly 32.8% of this group is now fully vaccinated.
How we did it: We analyzed coronavirus data related to cases, deaths, hospitalizations and vaccinations provided by the Los Angeles County Department of Public Health up through May 31, 2022.
Interested in our data? Check out the Crosstown coronavirus interactive map or email askus@xtown.la.


