The Crosstown COVID Tracker
![]()
Los Angeles County this month surpassed 3 million total COVID-19 cases since the start of the pandemic. The current spate of infections continues to be driven by Omicron variants.
Although there remains a week-over-week increase in cases, and the positivity rate has soared this week, hospitalizations and deaths remain relatively low.
One significant advance in the past week was an FDA advisory panel urging that authorities make the Pfizer and Moderna vaccines available for kids 5 and under. If approved, those as young as 6 months could get a shot.
The Crosstown COVID Tracker provides the latest and most important data on infections, inoculations and general risk. Information on cases in individual communities is available on the Crosstown coronavirus interactive map.
Climbing case counts
The seven-day average number of daily new cases increased to 4,679 on Thursday. That’s a 59% rise from the average number of cases reported one month ago.
Weekly COVID-19 cases in Los Angeles County, May 11-June 14

The current numbers are significantly higher than those reported this time last year, when the daily average was 190.
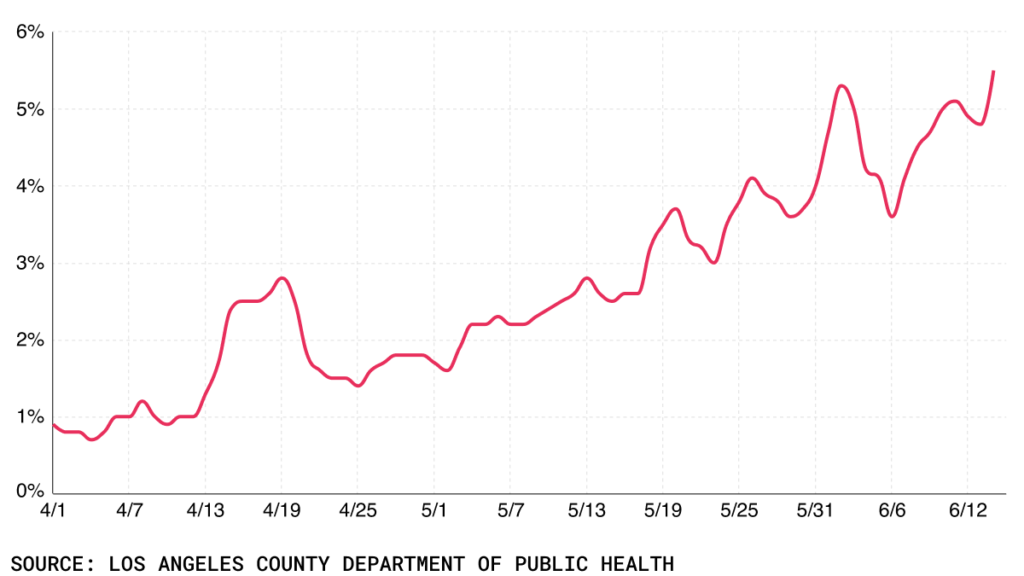
One point of concern is the positivity rate. In early June it ticked past 5%, the first time over that plateau in nearly four months. It has rocketed upwards all week, from 4.8% on Monday to 5.5% on Tuesday to 6.7% on Wednesday, before reaching 8.2% on Thursday. The last time the rate was north of 8% in L.A. County was Feb. 2.
COVID-19 positivity rate in Los Angeles County, April 1-June 14

Concern for the kids
One question as summer approaches is, what happens to case rates for kids? The Los Angeles Unified School District ended the academic year last week, though some campuses have students on hand for summer school and other activities. From June 8-14, the district recorded 2,677 positive results out of the 193,895 tests administered. The positivity rate was 0.44%.
According to the Department of Public Health, the age group with the current highest infection rate in Los Angeles County is people 12-17; their rate is 762 cases per 100,000 residents. That is more than double the rate from one month ago, when it was 363 cases per 100,000 inhabitants.
Over the past month, unvaccinated teens in this age group were four times more likely to need treatment in area hospitals than their vaccinated counterparts.
[Get COVID-19, crime and other stats about where you live with the Crosstown Neighborhood Newsletter]
Deaths and hospitalizations
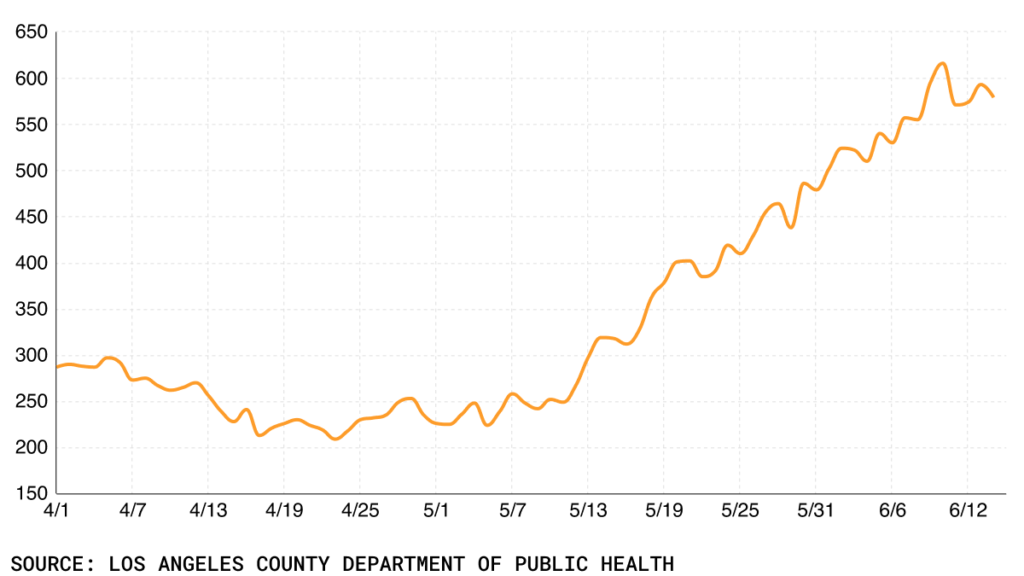
The higher case numbers in Los Angeles have translated to an increase in hospitalizations. Over the last week, the average number of people hospitalized with COVID-19 was 592. That’s a 105.6% increase from one month ago, when the average per day was 288.
On Thursday, 605 COVID-19 patients were being treated in area hospitals. That’s a 9% rise from the 555 hospitalized one week prior.
COVID-19 hospitalizations in Los Angeles County, April 1-June 14

Deaths still remain markedly low. On Thursday, the Department of Public Health reported 9 deaths, bringing the seven-day average of fatalities to 7. During the Omicron surge in January and February there were sometimes more than 100 COVID-19 deaths per day.
Not enough jabs
There are 8,163,338 Los Angeles County residents who have received at least one vaccine dose. While that means more than 83% of the population has some level of protection, there are still nearly 1.5 million Angelenos who remain unvaccinated.
Altogether, 19,127,226 shots have been administered in Los Angeles County. One year ago, 9,924,916 doses had gone into arms.
How we did it: We analyzed coronavirus data related to new cases, deaths, hospitalizations and vaccinations provided by the Los Angeles County Department of Public Health, as well as data from the Los Angeles Unified School District.
Interested in our data? Check out the Crosstown coronavirus interactive map or email askus@xtown.la.


