

5 things to know about COVID-19 this week


The truth that no one wants to hear is undeniable: Los Angeles, like much of the rest of the country, is mired in another wave of COVID-19. The health situation is changing rapidly.
Each week Crosstown runs down the key things that you need to know about the impact the coronavirus is having on the region. More information on case counts in individual neighborhoods is available on the Crosstown coronavirus interactive map.
1) Los Angeles County enters High territory
On July 14, Los Angeles County passed an important barrier: more than 10 hospital admissions per 100,000 residents. According to the Centers for Disease Control and Prevention, this places the county in what is known as the High COVID Community Level.
This is more than just a label, as it puts the Los Angeles County Department of Public Health on the path to reinstate an indoor mask mandate as early as July 29 (it happens once the county remains in the High level for two consecutive weeks).
Masks are already required on public transit and in healthcare facilities, but soon you may no longer see full faces in supermarkets, theaters and elsewhere.
[Get COVID-19, crime and other stats about where you live with the Crosstown Neighborhood Newsletter]
2) Climbing cases
For the fourth consecutive week, the number of new cases in the county has increased. Once again, blame the highly transmissible Omicron subvariants.
The seven-day average of cases on Wednesday was 6,731. That represents a 13.3% increase from the previous week.
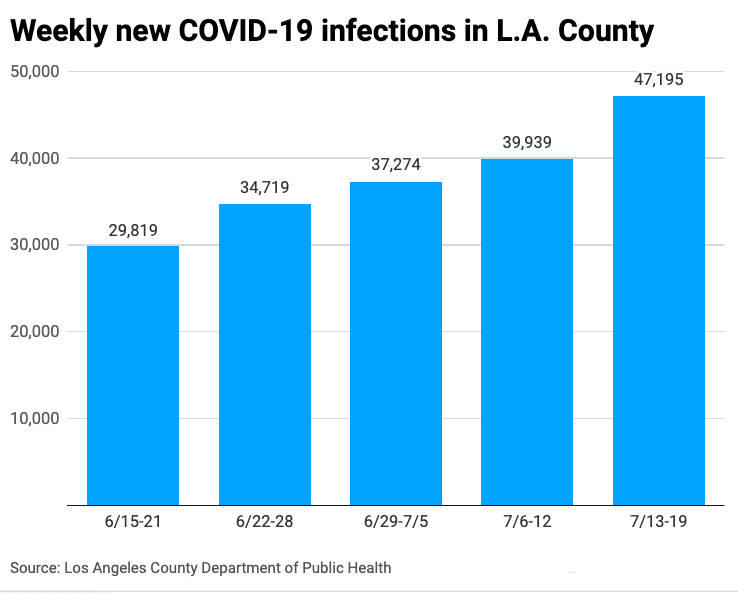
Last Friday, the region counted 8,954 new COVID-19 cases, the highest number since Feb. 5. One month ago, the seven-day average was 4,405.
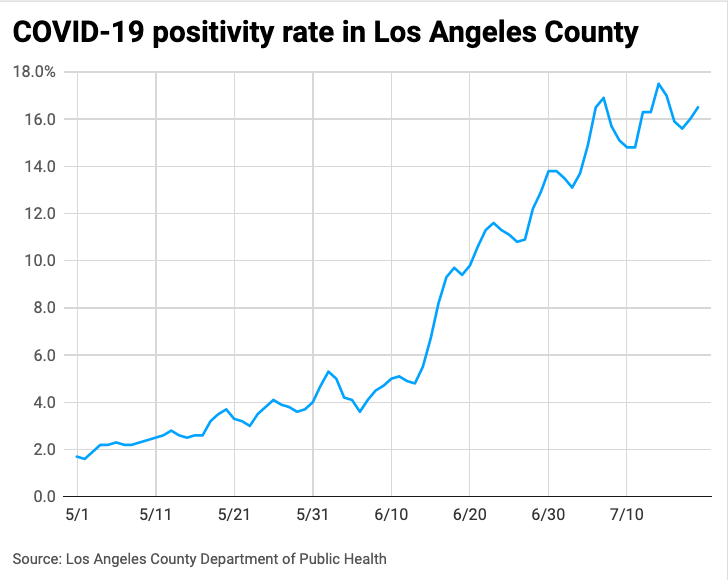
3) More positive tests
Throughout May, the test positivity rate in the county was below 5%. As with so much else, that seems like another era. The rate has been north of 15% for nine consecutive days.
On Wednesday, 16.7% of COVID-19 tests came back positive. But once again, the true positivity rate—as well as the actual number of cases—is a mystery, due to the prevalence of at-home tests and results that are never reported to health authorities.
4) Unequal impact in hospitals
COVID-19 has always impacted poor communities more than wealthy ones; this has been attributed to low-income earners often working in essential positions, and having more residents per household.
The impact is being felt again. According to the County Department of Public Health, as of July 8, the hospitalization rate in low-income communities was 71% higher than in the highest-income areas in the region. Over the past month, hospitalizations in upper-income areas grew 7%, while they surged 24% in lower-income neighborhoods.
The hospital admission rate stands at 10.5 per 100,000 residents, an 88% increase from one month ago. On Wednesday, there were 1,328 county residents receiving treatment for COVID-19 in area hospitals. That is the highest figure since Feb. 21.
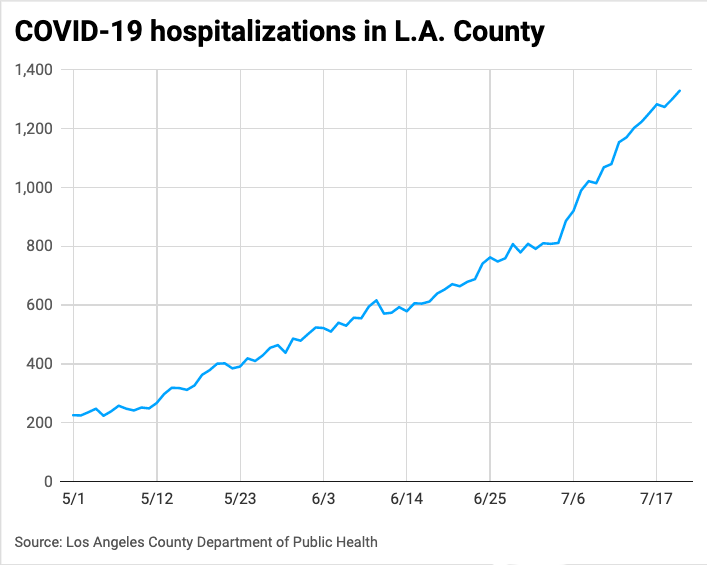
It is worth remembering that there is nuance in the numbers. According to the Department of Public Health, less than half of those with COVID-19 in local hospitals were admitted because of coronavirus complications. In many instances, people in hospitals for other treatment are tested and come back positive, even if they are asymptomatic.
5) Dealing with death
On Saturday, the Department of Public Health reported 19 fatalities, the highest count since early April. On Wednesday, there were another 18 deaths.
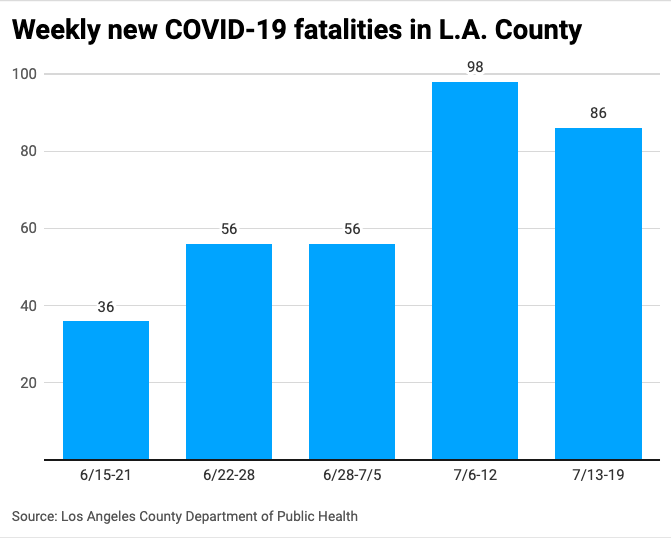
Although the 86 COVID-19 deaths in the week of July 13–19 was 12 fewer than the previous week, the situation may be changing. Deaths, like hospitalizations, are a lagging indicator, and tend to increase several weeks or a month after cases spike. The days of single-digit death tolls, recorded a few months ago, are likely gone for the foreseeable future.
The total number of fatalities in Los Angeles County surpassed 32,500 this week.
How we did it: We analyzed coronavirus data related to new cases, deaths, hospitalizations and vaccinations provided by the Los Angeles County Department of Public Health.
Interested in our data? Check out the Crosstown coronavirus interactive map or email askus@xtown.la.


