

The Crosstown Crime Book: July


News reports and social media are filled with stories about crime statistics in Los Angeles. But big numbers in a headline can border on useless—it takes context to understand the overall situation.
The Crosstown Crime Book provides that context. We look at the monthly figures in key crime categories and compare them with recent months, as well as the same month in the past five years. This includes the period before the COVID-19 pandemic.
Here is what Los Angeles looked like in July.
Death toll
In July 2021, the city of Los Angeles recorded 48 murders, more than any month since at least 2010. The death toll decreased last month, though there is no reason to cheer: July brought 42 homicides, according to publicly available Los Angeles Police Department data. That is the second-highest monthly total in the last 12 years.
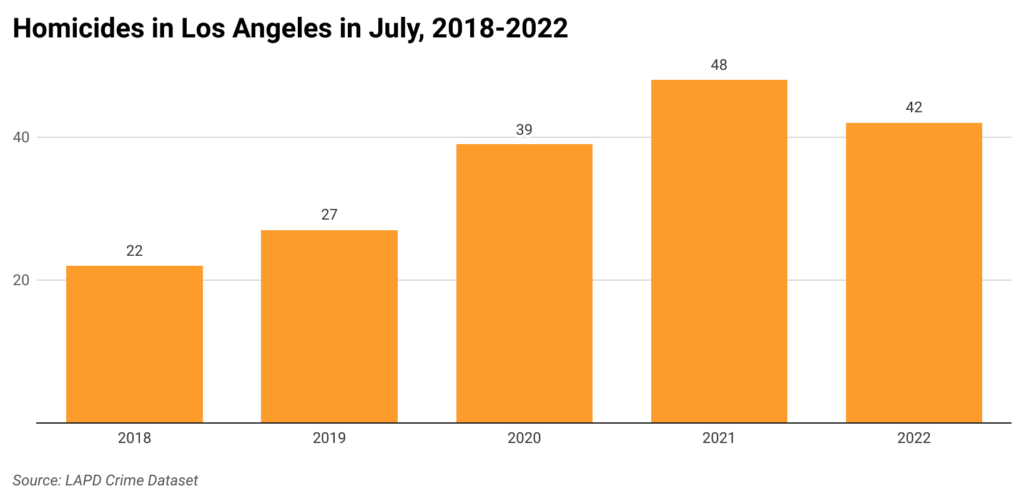
There were four homicides in Westlake last month, more than any other Los Angeles neighborhood. As has been the case throughout much of the year, a firearm was the murder weapon in nearly three-quarters of the killings in July.
From Jan. 1–Aug. 13, the city experienced 243 murders, one more than in the same period last year, according to LAPD Compstat data. In the equivalent timeframe in 2020, there were 193 homicides.
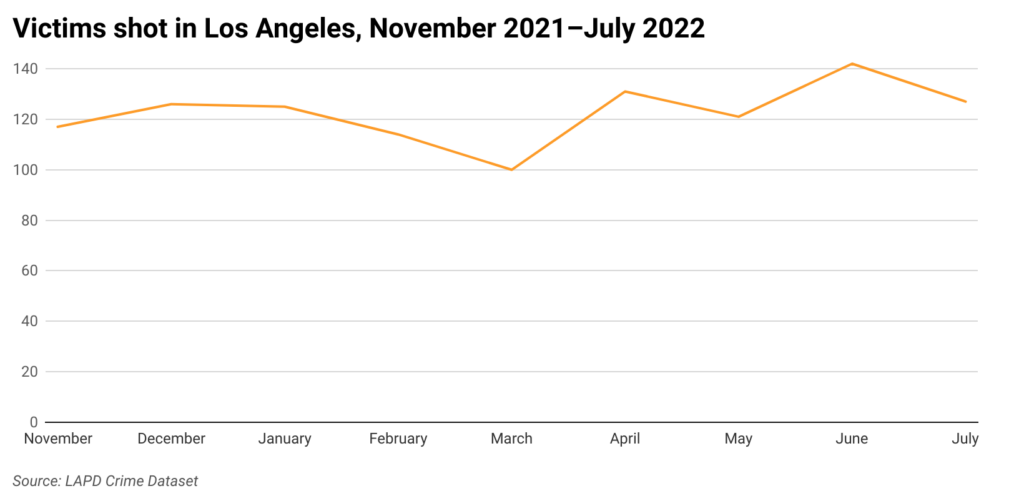
Although more people were killed in July than in the previous month, the number of shooting victims declined. According to LAPD data, 127 people were struck by gunfire in the city last month, down from 142 in June.
The prevalence of weapons, including untraceable ghost guns, remains a pressing concern for Police Chief Michel Moore. During the Aug. 16 meeting of the Los Angeles Police Commission, Moore said that the number of robberies in the city is equivalent with the period before COVID-19.
“The stark difference is the number of robberies involving firearms are up 60% from that same period,” Moore stated.
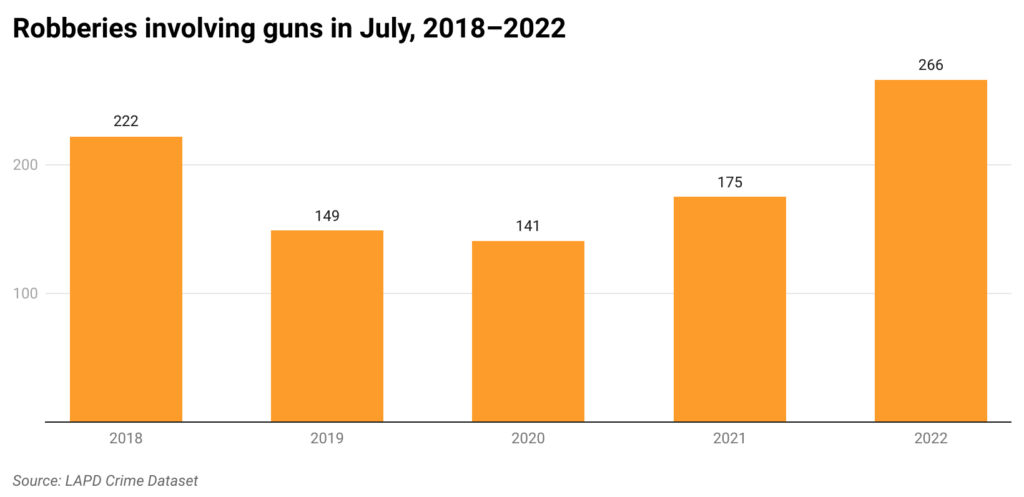
There were 858 robberies in Los Angeles in July, according to LAPD data. That is the highest monthly total since the onset of the pandemic.
The 84 robberies last month in dense Downtown was the high among Los Angeles neighborhoods. The second most-impacted community was Hollywood, with 47 robberies.
[Get COVID-19, crime and other stats about where you live with the Crosstown Neighborhood Newsletter]
More rides missing
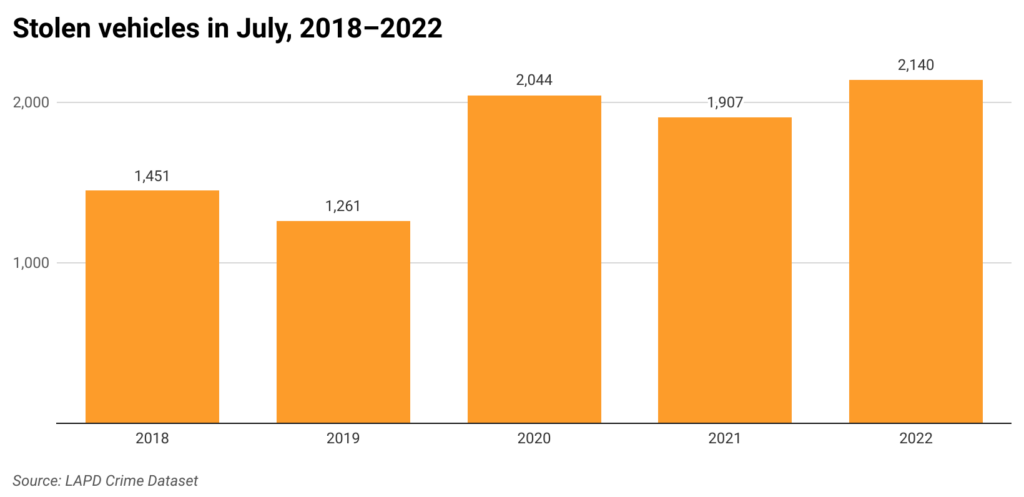
Car thefts in Los Angeles began increasing almost as soon as COVID-19 hit and people cut back on driving (the situation was the same in many cities across the country). Even though most Angelenos are now regularly on the road, the trend has worsened.
There were 2,140 stolen vehicle reports in July, marking the 11th time in the past 12 months that the monthly total surpassed 2,000. That plateau was not hit in even a single month during the 2010s.
The July figure represents a nearly 70% increase over the 1,261 stolen vehicles in the same month in 2019.
July produced 1,239 burglaries, which is more than the same month last year, but below the level in May and June.
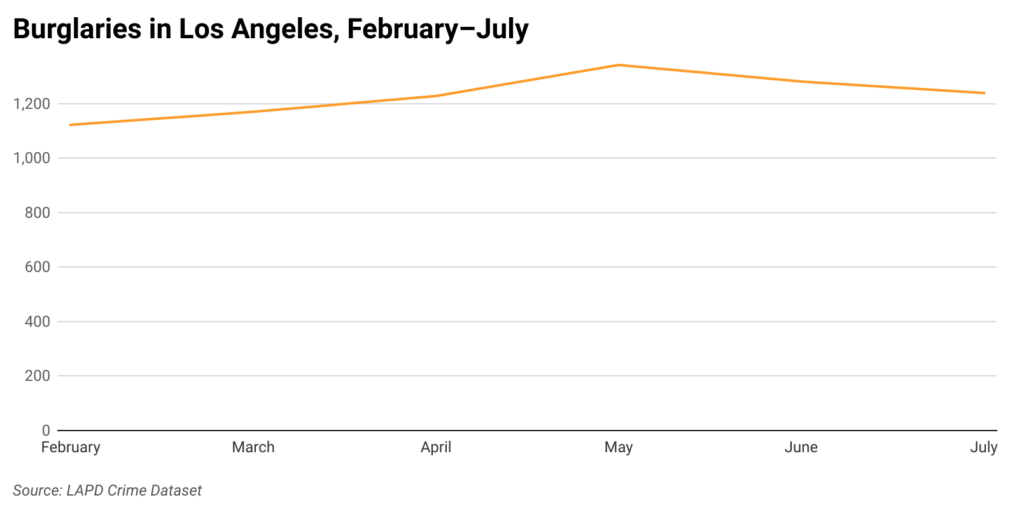
Once again, busy Downtown saw more reports than any other L.A. community, with 70 burglaries last month. There were 43 incidents in Koreatown.
Total property crime in the city this year (through Aug. 13) is 13.2% higher than last year, according to Compstat data. The 60,816 reported property crimes is 9.8% above the level at this point in 2020.
How we did it: We examined publicly available crime data from the Los Angeles Police Department from Nov. 1, 2021–July 31, 2022, and the periods of July 1–31 from 2018–2022. We also examined LAPD Compstat data. Learn more about our data here.
LAPD data only reflects crimes that are reported to the department, not how many crimes actually occurred. In making our calculations, we rely on the data the LAPD makes publicly available. LAPD may update past crime reports with new information, or recategorize past reports. Those revised reports do not always automatically become part of the public database.
Have questions about our data or want to know more? Write to us at askus@xtown.la.


