

Six charts to understand Los Angeles’s homelessness crisis


How does one grasp the scale and scope of Los Angeles’s homeless crisis?
On Thursday, the Los Angeles Homeless Services Authority, the main county agency that tracks homelessness, coordinates services and helps distribute funds to myriad social services organizations, released its annual snapshot of how many people are currently unhoused.
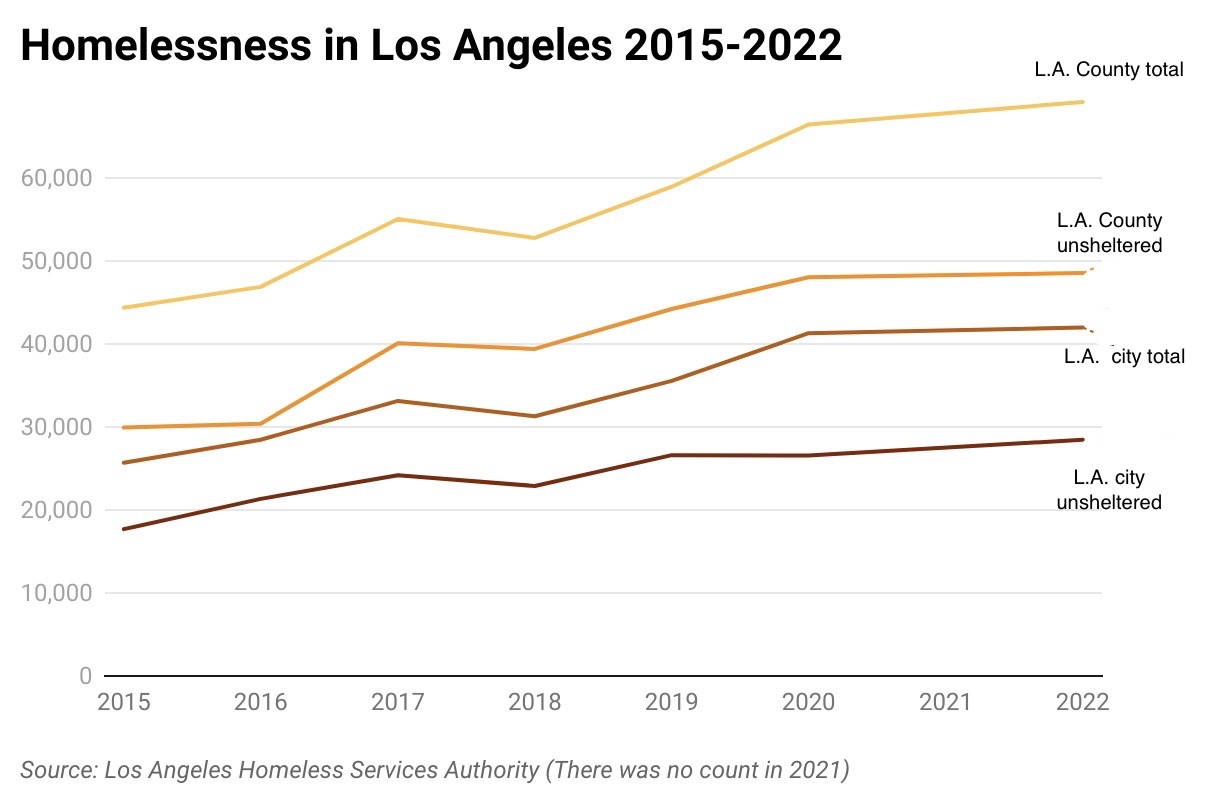
The Greater Los Angeles Homeless Count was conducted over three nights in February. Although the number of people experiencing homelessness in Los Angeles County grew to 69,144 (roughly the population of Redondo Beach), and 41,980 within the city of Los Angeles, it’s possible to see an ever-so-slight positive shift: The increase across the county slowed to 4.1% from 2020. (There was no count conducted in 2021 due to the pandemic.) The previous two counts produced jumps of 13% and 12%, respectively.
More than 70% of the homeless population in the county is designated as “unsheltered,” meaning they are most likely living on the streets.
[Get housing, crime and other stats about where you live with the Crosstown Neighborhood Newsletter]
When you chart it out, it looks like this.
The rent is due
Those numbers only tell part of the crisis. During the pandemic, rents across the county surged. In some places, such as Pomona, they rose by 35%.
As Crosstown reported recently, with every $100 increase in median rent, there’s a 9% rise in the estimated homelessness rate, according to a calculation by the U.S. Government Accountability Office.
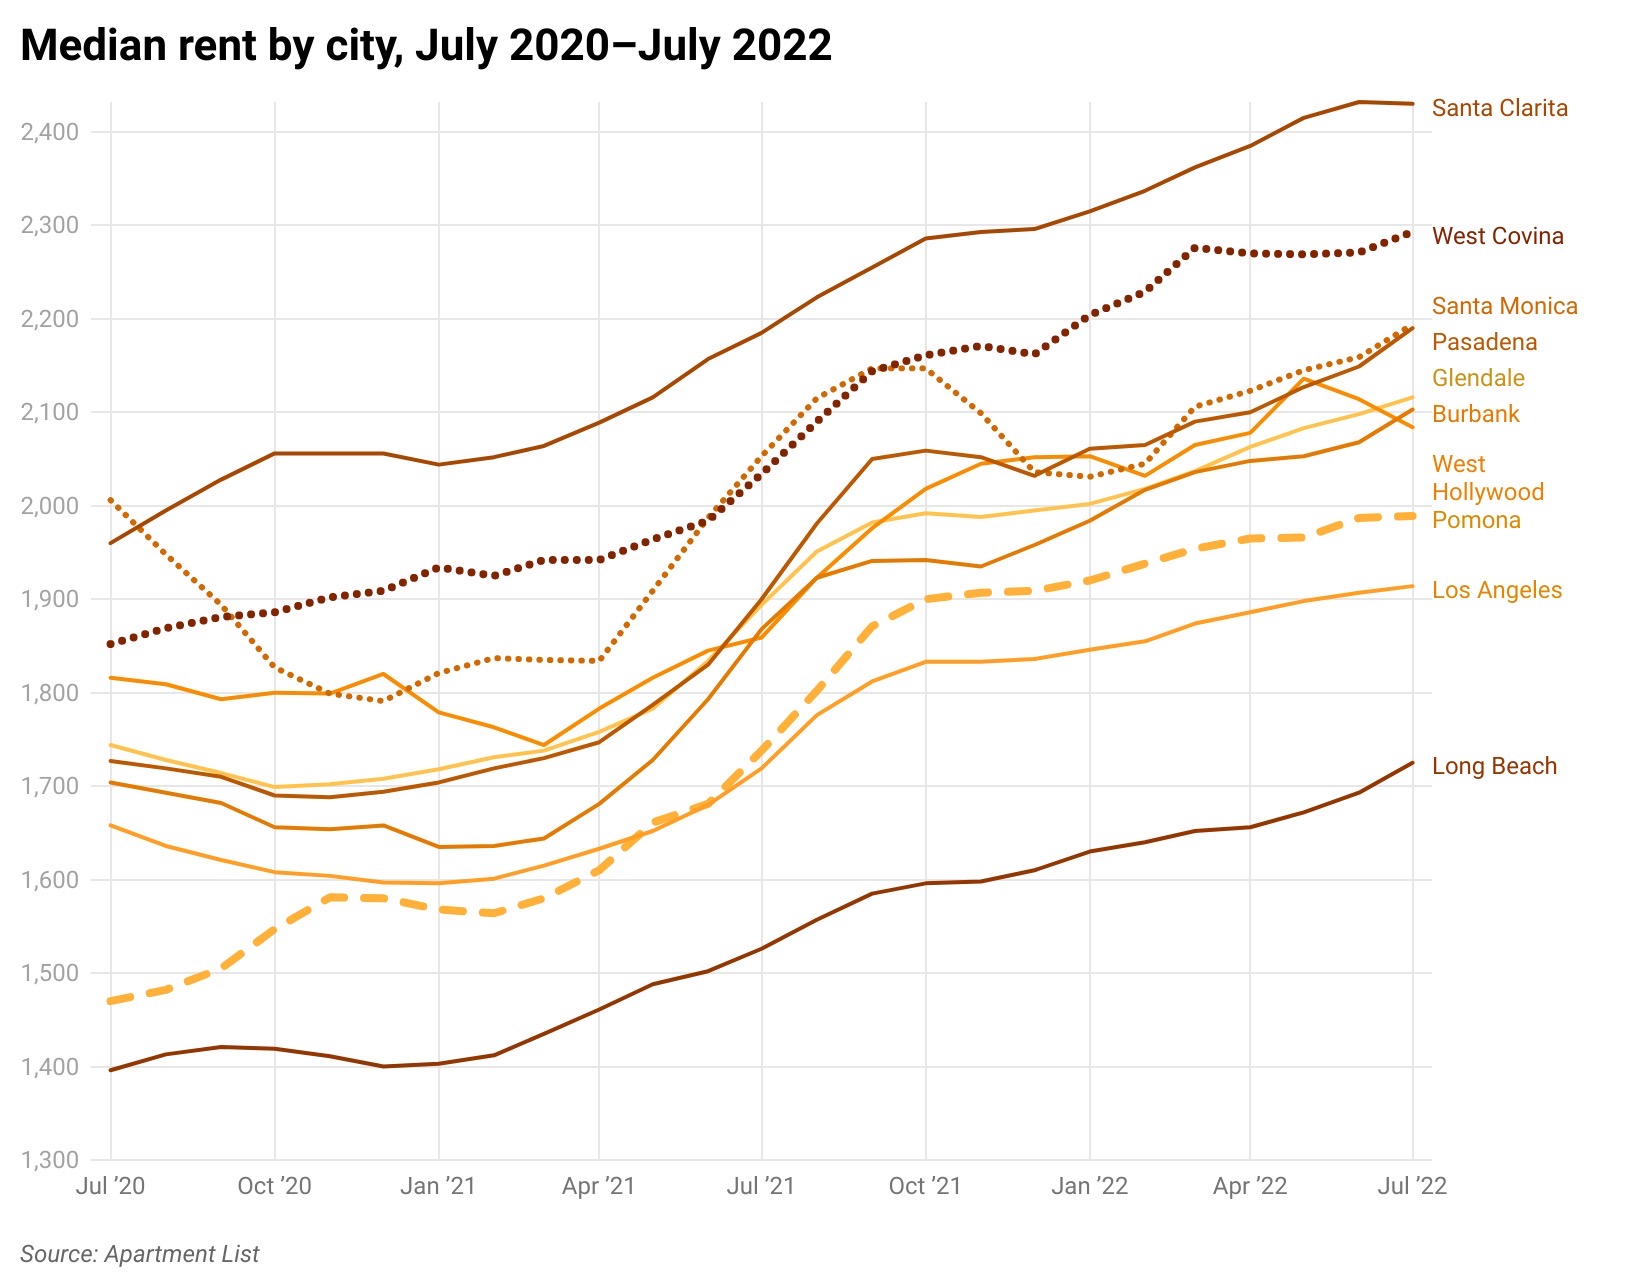
Without a significant increase in the overall amount of housing, rents will rise further. And so will the number of people experiencing homelessness.
People are dying on the streets
The number of people experiencing homelessness who perish on the streets, under overpasses, in hotel rooms and at bus stops is climbing faster than homelessness itself.
Last year, 1,612 people experiencing homelessness died, according to the Los Angeles County Coroner.
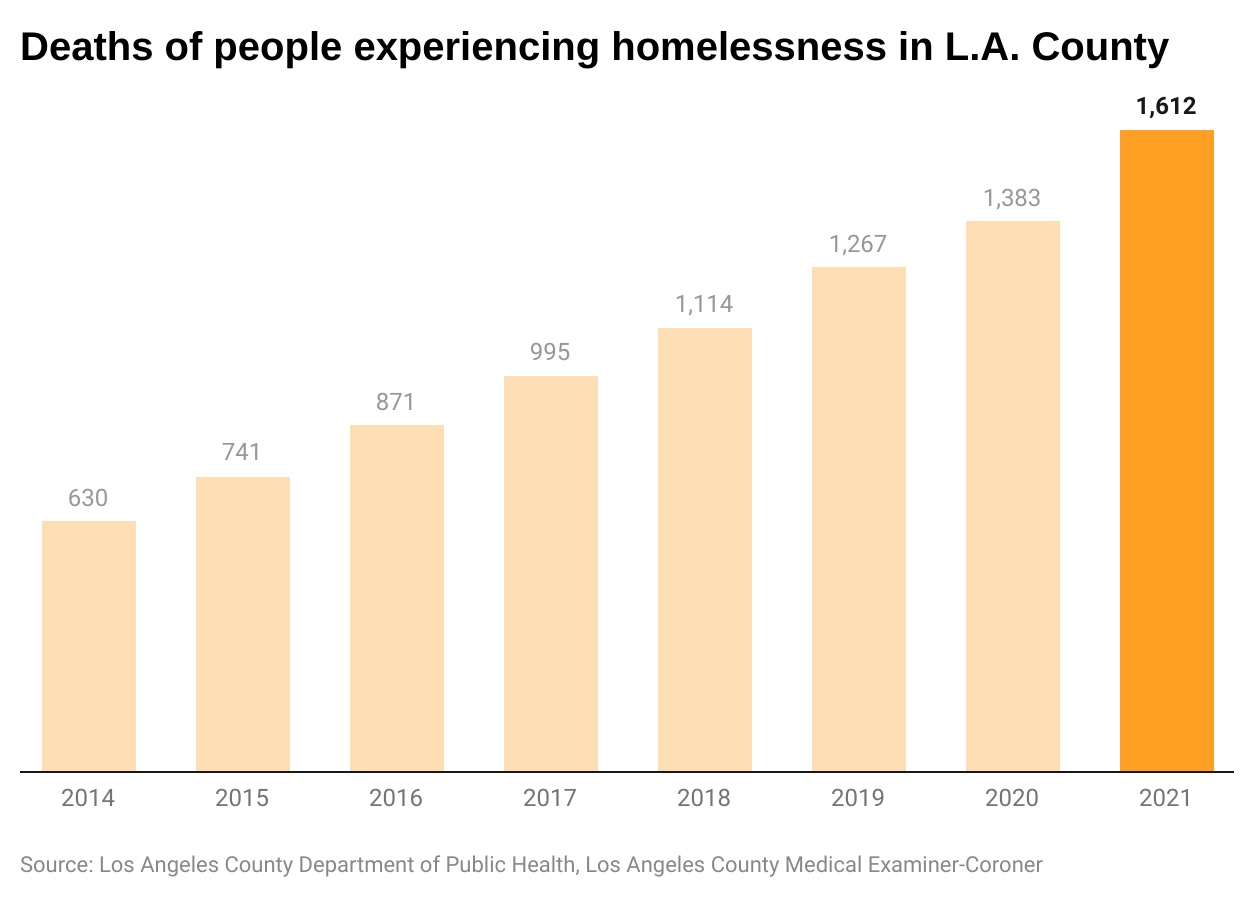
That is almost triple the figure from 2014.
Murder is a leading causes of death
Los Angeles’s murder rate has shot up during the pandemic. Last year, there were 397 homicides in the city, the highest total in almost 15 years.
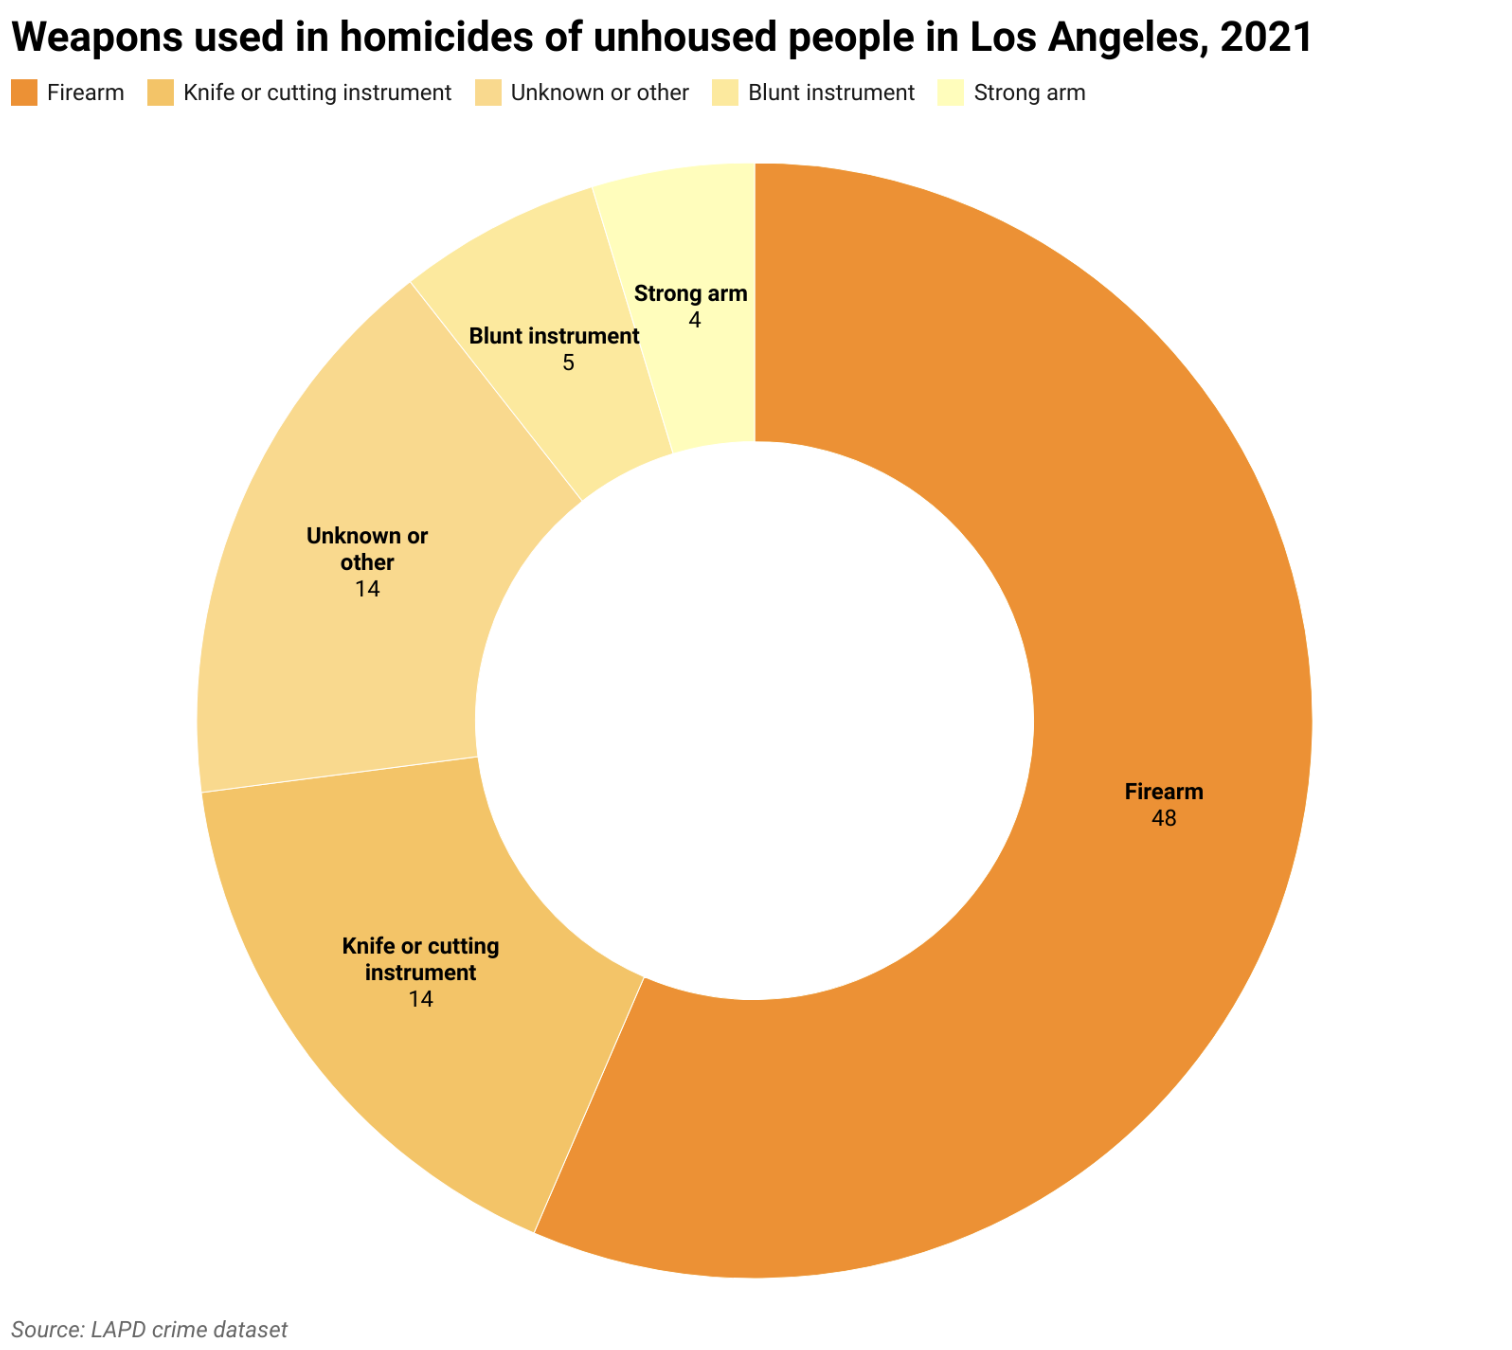
People experiencing homelessness are much more likely to be killed on the street. Last year, there were 85 victims, or more than 21% of all homicides.
That represented a 47% increase from 58 unhoused victims the previous year, and a 102% spike over the 42 victims in 2019.
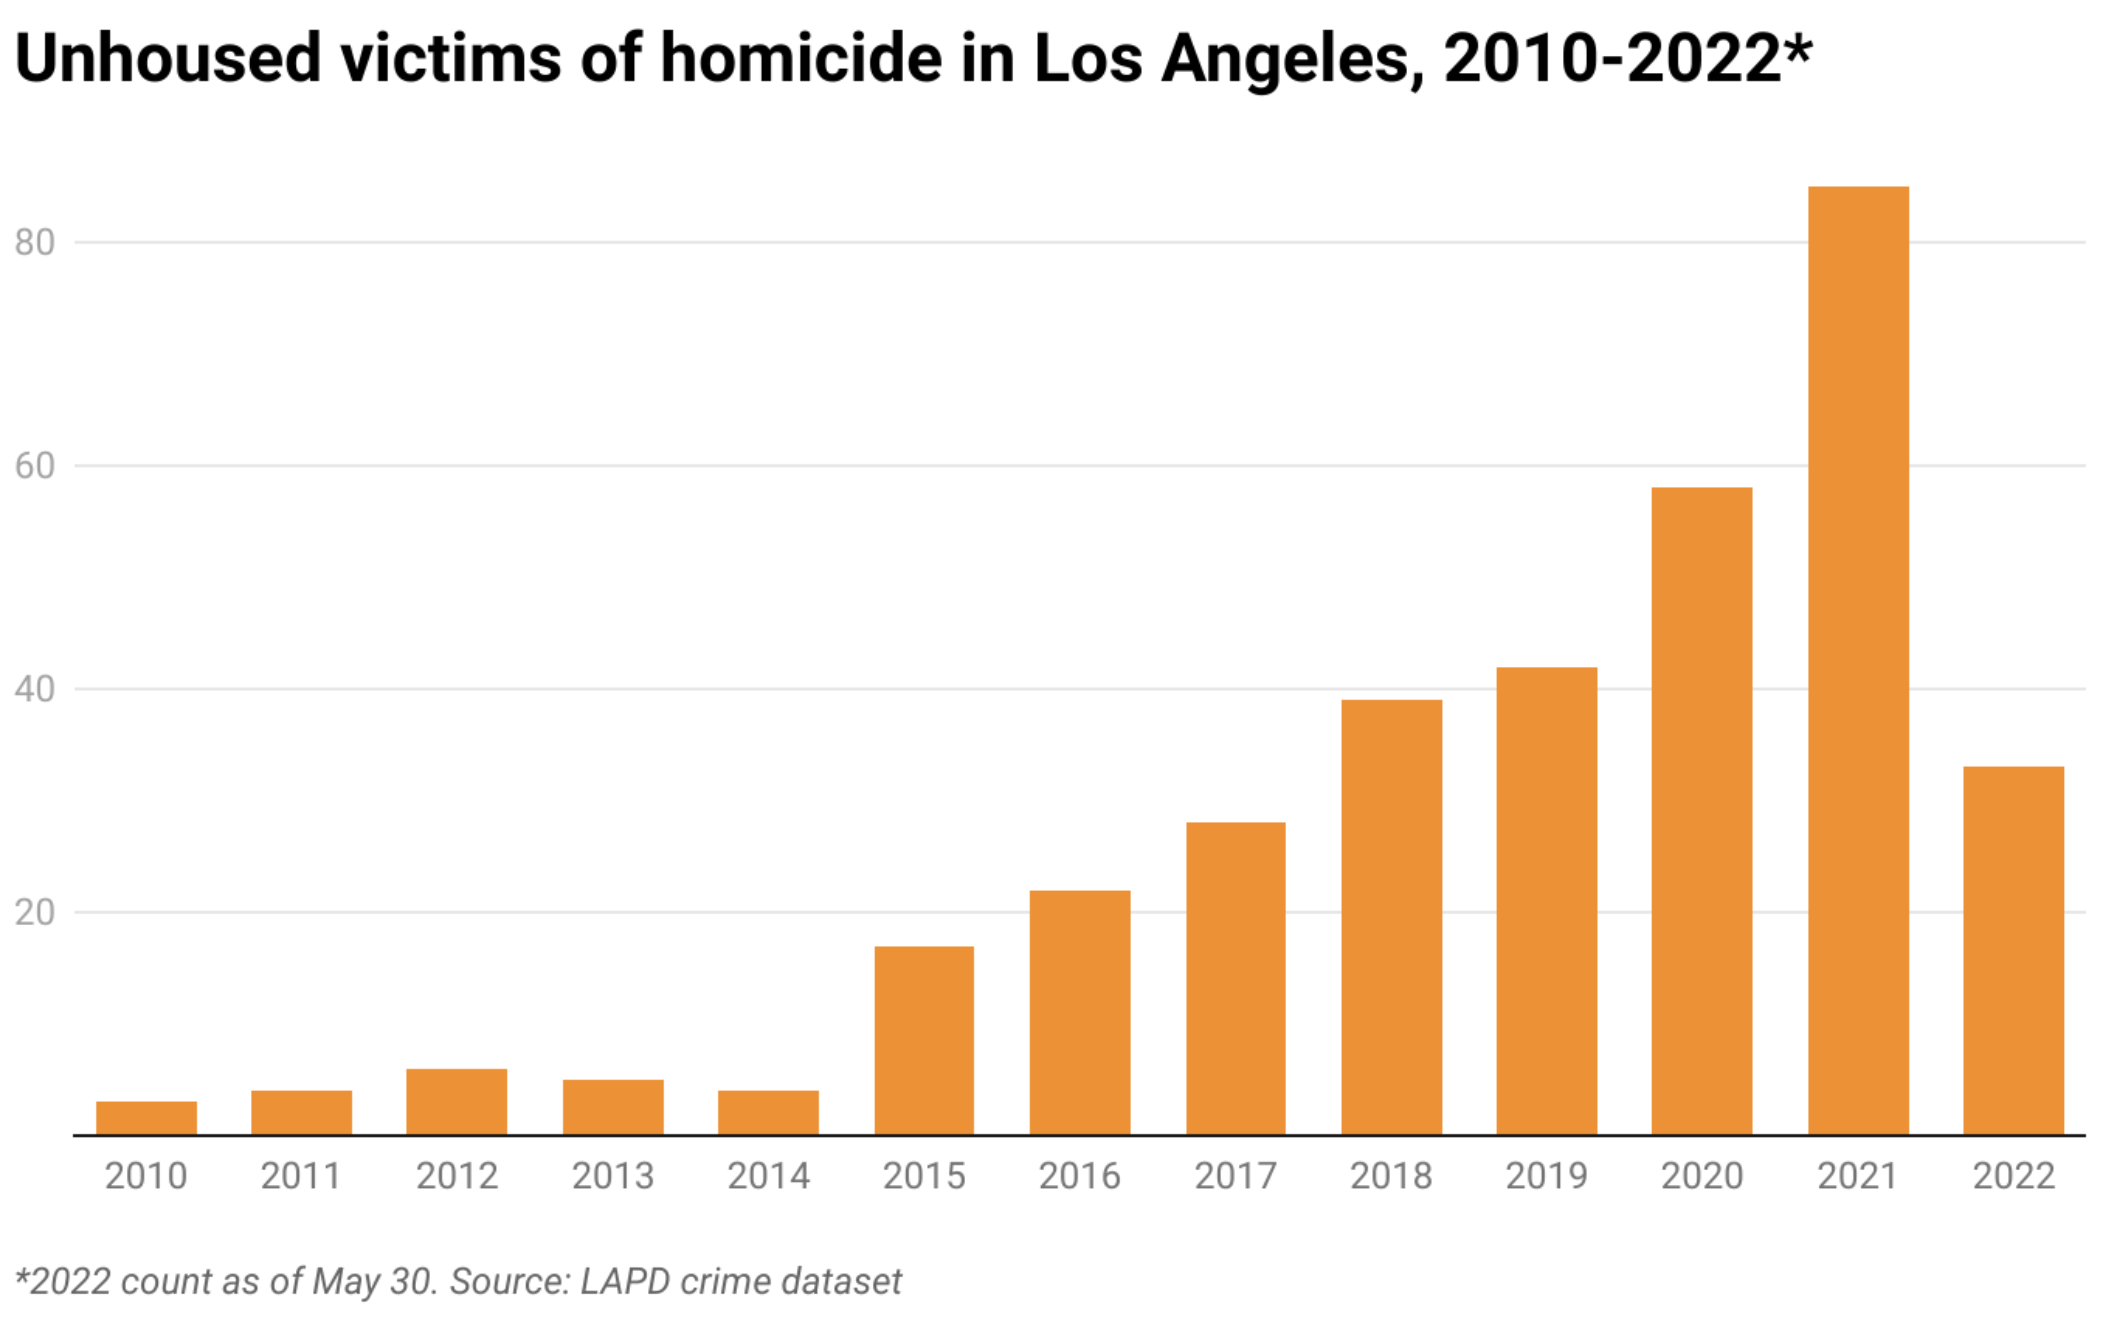
The overwhelming majority (79) of those killed were men. And most of the victims (48) were shot.
Unhoused crime victims
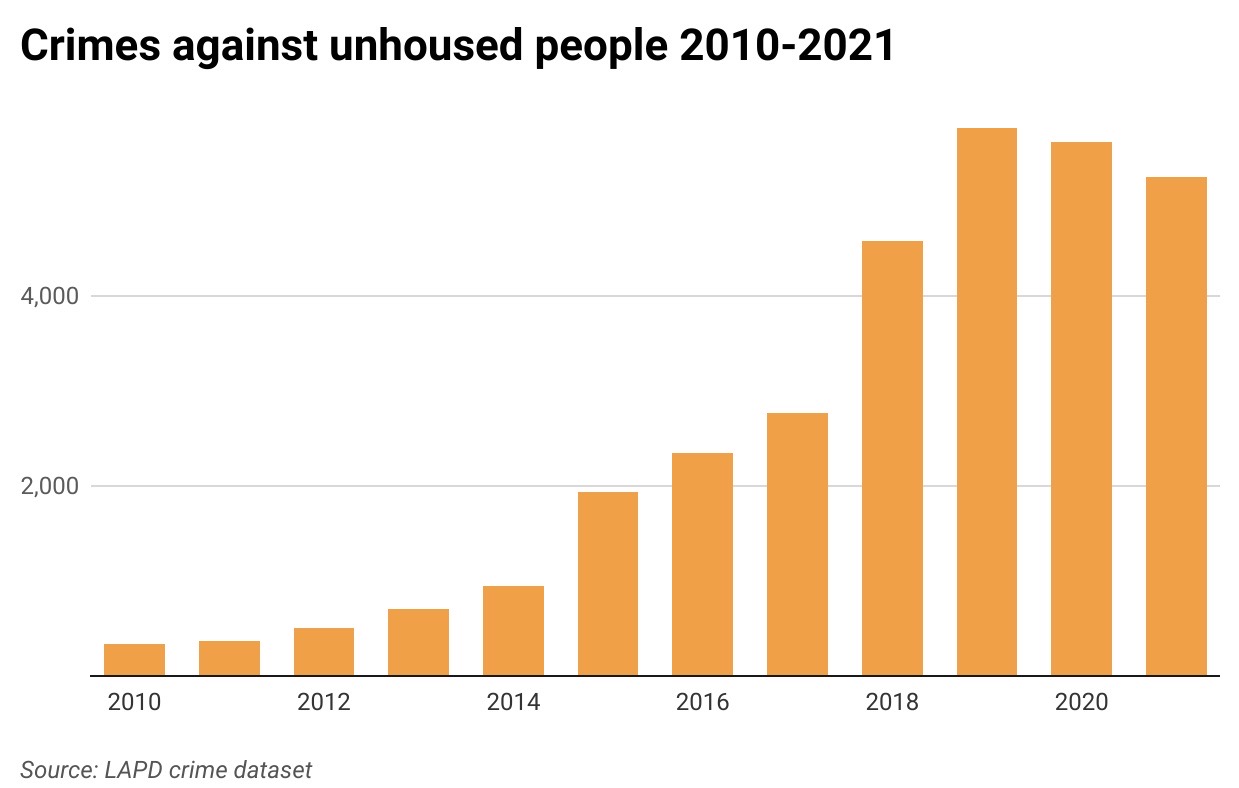
Not surprisingly, people experiencing homelessness are also much more likely to be the victim of other crimes as well, such as assault.
Last year, the Los Angeles Police Department recorded 5,264 crime victims as unhoused. That works out to one of every 14 unhoused people in the city. Five years ago it was less than half that, at 2,348 victims.
How we did it: We examined publicly available crime data from the Los Angeles Police Department from 2010-2021, as well as data from the Los Angeles Housing Services Authority and rent data compiled by Apartment List. Learn more about our data here.
Have questions? Write to us at askus@xtown.la.


