

The Month in COVID: November


It has quickly become clear that the cold weather is producing another COVID-19 surge in Los Angeles. Each month, Crosstown runs down the latest figures. Here is the picture for November.
Cases
The average number of infections more than doubled last month. The Los Angeles County Department of Public Health recorded 51,388 coronavirus cases in November, marking a 70.4% increase from October. The daily peak occurred on Nov. 30, with 4,353 cases, just after Thanksgiving. The low was the 654 cases reported on Nov. 7.
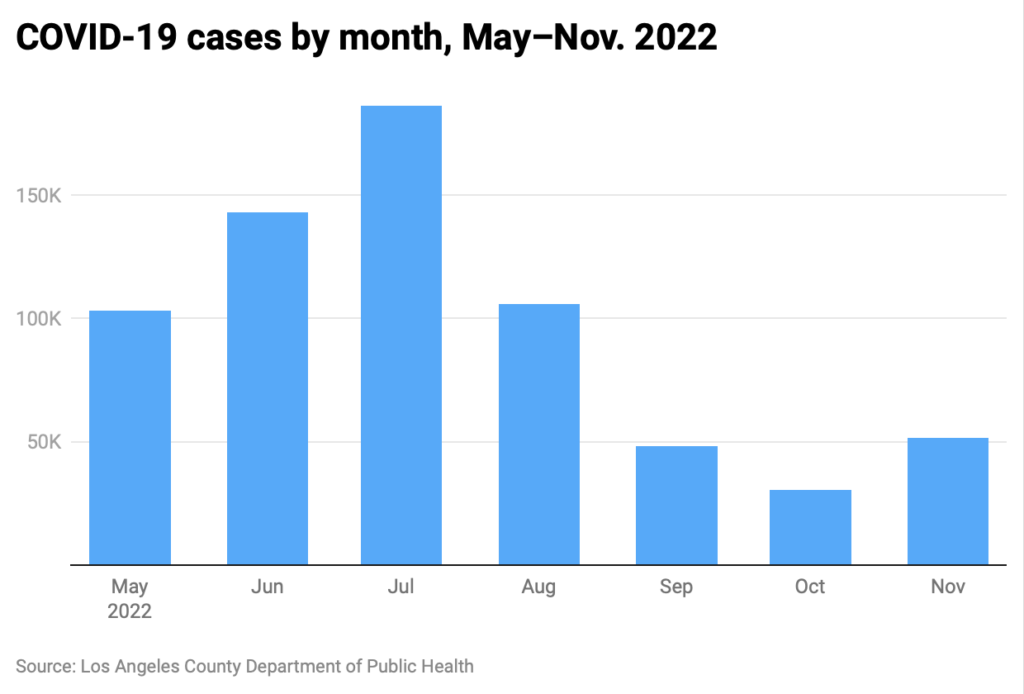
In November 2021, case counts actually dropped over the course of the month. This year, however, the month started with 963 average cases and ended with 2,367.
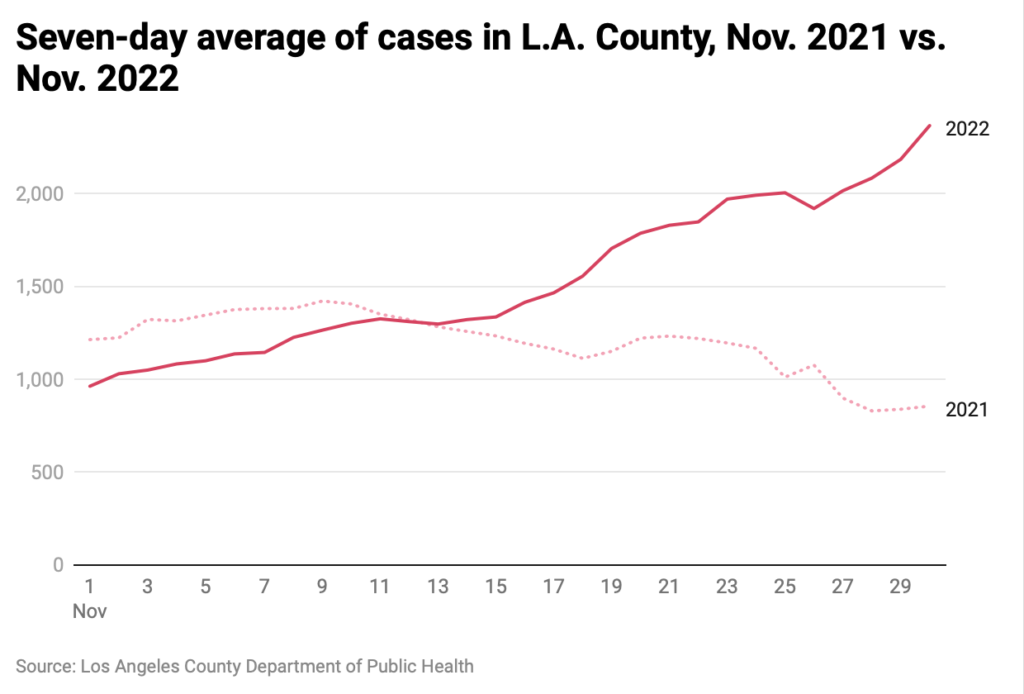
In the first few days of December, average cases have reached nearly 4,000 per day.
As a reminder, these are just cases reported to county health officials, and the actual number of infections is likely much higher. The prevalence of at-home tests, and people who have positive results but only mild symptoms, makes it difficult if not impossible to identify a true count.
[Get COVID-19, crime and other stats about where you live with the Crosstown Neighborhood Newsletter]
Positivity rate and hospitalizations
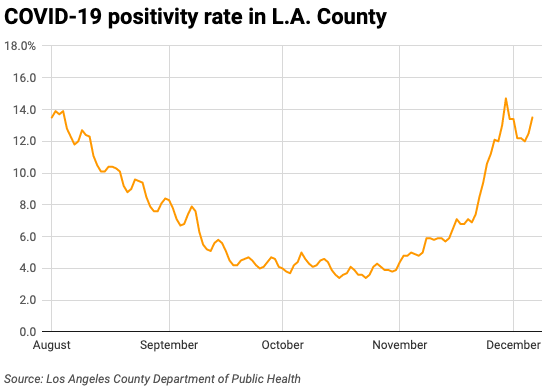
In October, the positivity rate hovered around 4%. In November it skyrocketed, peaking at 14.7% on Nov. 29. This was the highest level since late July.
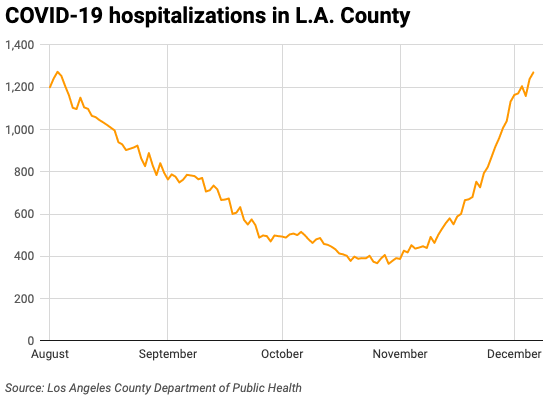
Hospitalizations have also spiked. On Nov. 1, health officials reported that 388 people were hospitalized with COVID-19. On Nov. 30, the figure had nearly tripled to 1,132.
Last month, the average number of hospitalizations per day was 645. This is a 48.3% increase from nearly 450 in October.
Taking shots
The bivalent booster has been available in Los Angeles since September. Health leaders have been hoping there would be an uptick in vaccination rates, yet the opposite is happening.
According to the Department of Public Health, only 6,557 Angelenos received COVID vaccine doses in November, setting an unfortunate “record” for the lowest monthly count. Last November, 338,252 people received the jab, according to the department’s vaccine dashboard. The peak occurred in March 2021, when vaccines were just being rolled out widely and more than 1.7 million county residents got their shot.
The slow pace of inoculations is believed to be a factor in worsening regional metrics. The department has eight early alert signals that it tracks. By the middle of last month, one metric was at the high concern level and three were at medium concern. Now, three metrics rank at high concern (the darkest pink in the below table) and four are at medium concern.
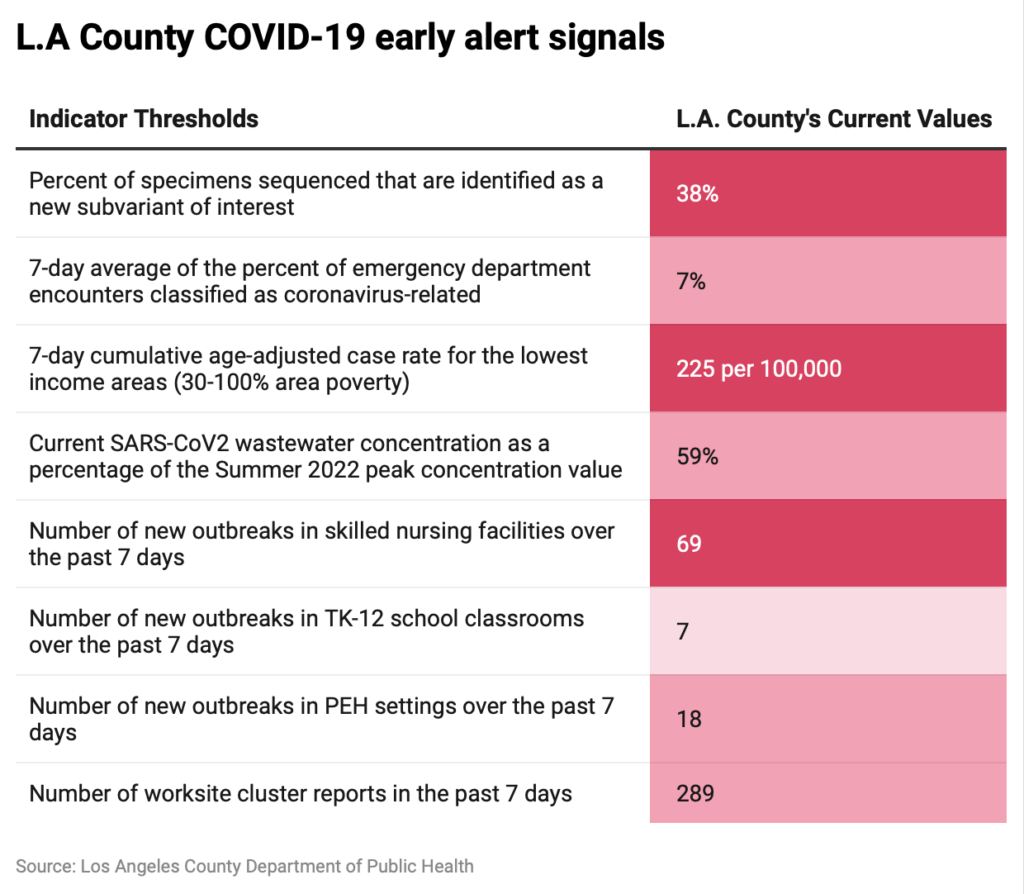
The county also tracks hospitalization metrics, and figures play a key role in determining if there will be a new indoor mask mandate. There are two thresholds to watch: if the rate of daily hospital admissions exceeds 10 per 100,000 residents; and if more than 10% of hospital beds are occupied by COVID patients. According to ABC 7, the county has already surpassed the first threshold. As of Saturday, 6.8% of hospital beds were occupied by COVID patients, according to the Centers for Disease Control and Prevention.
Currently, masks are strongly recommended for indoor locations, but if current conditions worsen, a mandate could come early in the new year.
Deaths
Unlike other key metrics, deaths decreased during November. However, fatalities are known to be a lagging indicator, and in previous waves have risen weeks or months after a surge started, and then remained high even as case counts waned.
An estimated 225 Angelenos died of COVID-19 in November, marking a 31.6% decrease from October. The number of daily deaths peaked at 11 on Nov. 24.
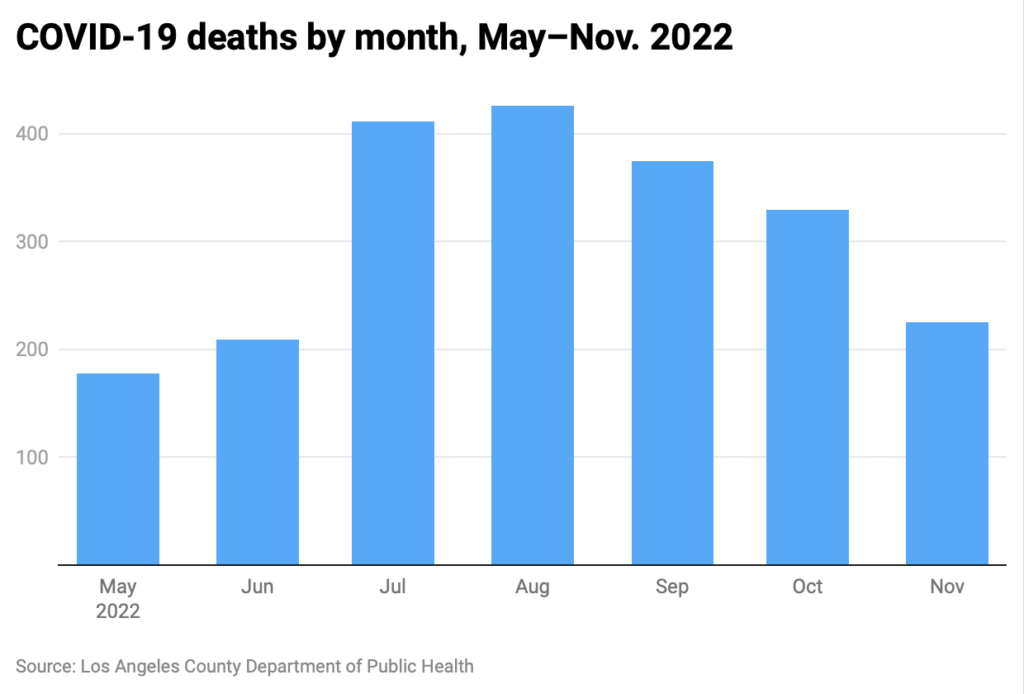
At the beginning of the month, the seven-day average for COVID-19 fatalities was 10. On Nov. 30, it was down to 8.
At the close of the month, the Department of Public Health reported 34,187 deaths since the start of the pandemic.
How we did it: We analyzed coronavirus data related to new cases, deaths, hospitalizations and vaccinations provided by the Los Angeles County Department of Public Health.
Interested in our data? Check out the Crosstown coronavirus interactive map or email askus@xtown.la.


